Guatemalan vs Immigrants from Micronesia Median Household Income
COMPARE
Guatemalan
Immigrants from Micronesia
Median Household Income
Median Household Income Comparison
Guatemalans
Immigrants from Micronesia
$75,961
MEDIAN HOUSEHOLD INCOME
0.3/ 100
METRIC RATING
264th/ 347
METRIC RANK
$75,574
MEDIAN HOUSEHOLD INCOME
0.2/ 100
METRIC RATING
275th/ 347
METRIC RANK
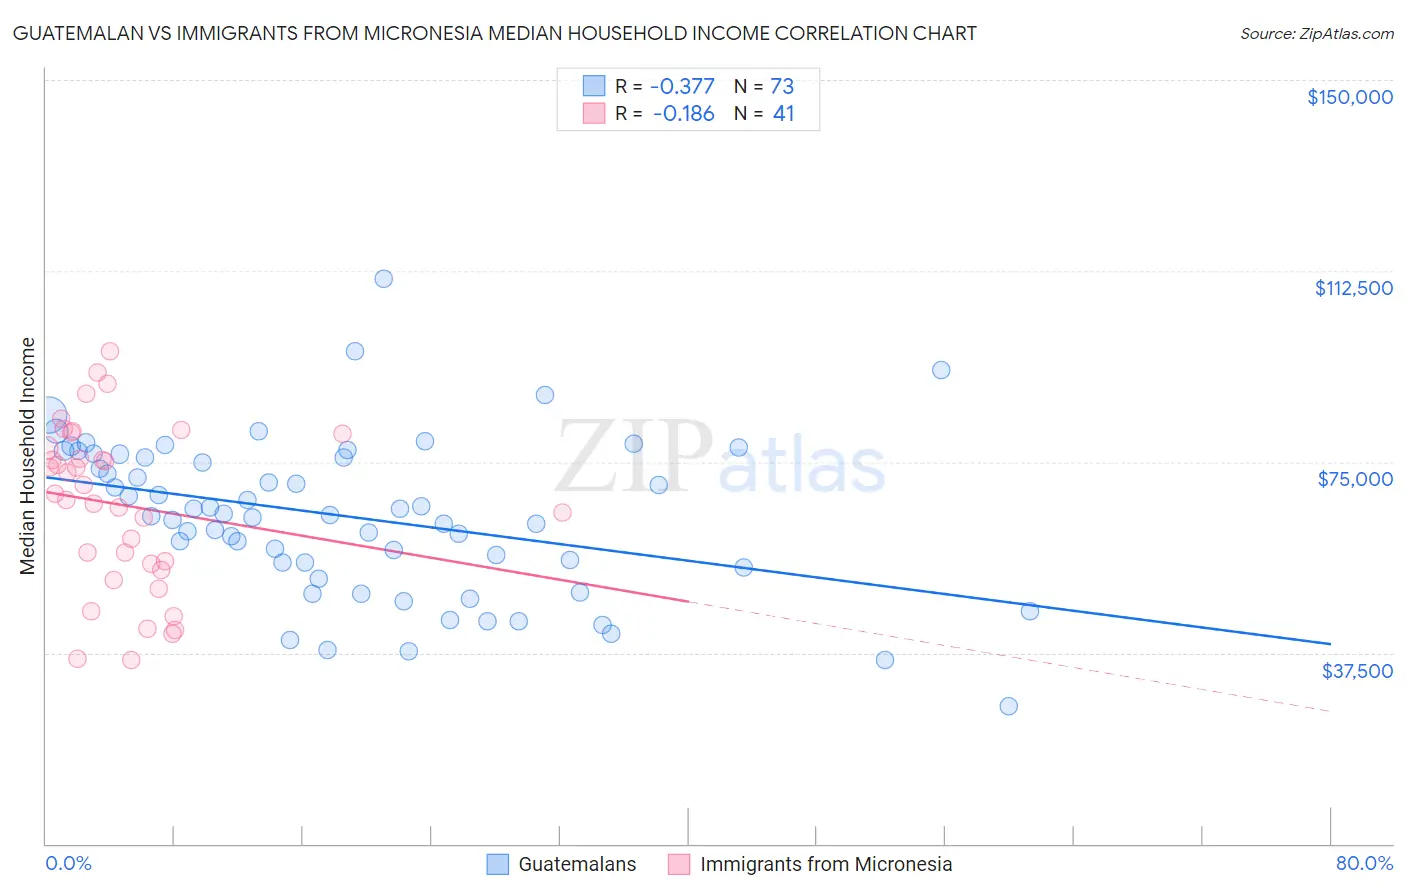
Guatemalan vs Immigrants from Micronesia Median Household Income Correlation Chart
The statistical analysis conducted on geographies consisting of 409,198,651 people shows a mild negative correlation between the proportion of Guatemalans and median household income in the United States with a correlation coefficient (R) of -0.377 and weighted average of $75,961. Similarly, the statistical analysis conducted on geographies consisting of 61,597,439 people shows a poor negative correlation between the proportion of Immigrants from Micronesia and median household income in the United States with a correlation coefficient (R) of -0.186 and weighted average of $75,574, a difference of 0.51%.
Median Household Income Correlation Summary
| Measurement | Guatemalan | Immigrants from Micronesia |
| Minimum | $26,979 | $36,071 |
| Maximum | $111,004 | $96,614 |
| Range | $84,025 | $60,543 |
| Mean | $64,179 | $66,523 |
| Median | $64,652 | $68,636 |
| Interquartile 25% (IQ1) | $54,709 | $54,388 |
| Interquartile 75% (IQ3) | $76,221 | $79,184 |
| Interquartile Range (IQR) | $21,512 | $24,796 |
| Standard Deviation (Sample) | $15,411 | $16,084 |
| Standard Deviation (Population) | $15,305 | $15,887 |
Demographics Similar to Guatemalans and Immigrants from Micronesia by Median Household Income
In terms of median household income, the demographic groups most similar to Guatemalans are Immigrants from Belize ($75,938, a difference of 0.030%), American ($75,932, a difference of 0.040%), German Russian ($75,856, a difference of 0.14%), Immigrants from Jamaica ($75,851, a difference of 0.15%), and Cape Verdean ($75,848, a difference of 0.15%). Similarly, the demographic groups most similar to Immigrants from Micronesia are British West Indian ($75,647, a difference of 0.10%), Liberian ($75,667, a difference of 0.12%), Immigrants from Latin America ($75,420, a difference of 0.20%), Spanish American ($75,386, a difference of 0.25%), and Somali ($75,782, a difference of 0.27%).
| Demographics | Rating | Rank | Median Household Income |
| Spanish American Indians | 0.4 /100 | #259 | Tragic $76,670 |
| Jamaicans | 0.4 /100 | #260 | Tragic $76,583 |
| Immigrants | Grenada | 0.4 /100 | #261 | Tragic $76,517 |
| French American Indians | 0.4 /100 | #262 | Tragic $76,387 |
| Alaskan Athabascans | 0.4 /100 | #263 | Tragic $76,383 |
| Guatemalans | 0.3 /100 | #264 | Tragic $75,961 |
| Immigrants | Belize | 0.3 /100 | #265 | Tragic $75,938 |
| Americans | 0.3 /100 | #266 | Tragic $75,932 |
| German Russians | 0.3 /100 | #267 | Tragic $75,856 |
| Immigrants | Jamaica | 0.3 /100 | #268 | Tragic $75,851 |
| Cape Verdeans | 0.3 /100 | #269 | Tragic $75,848 |
| Hmong | 0.3 /100 | #270 | Tragic $75,839 |
| Pennsylvania Germans | 0.3 /100 | #271 | Tragic $75,814 |
| Somalis | 0.3 /100 | #272 | Tragic $75,782 |
| Liberians | 0.2 /100 | #273 | Tragic $75,667 |
| British West Indians | 0.2 /100 | #274 | Tragic $75,647 |
| Immigrants | Micronesia | 0.2 /100 | #275 | Tragic $75,574 |
| Immigrants | Latin America | 0.2 /100 | #276 | Tragic $75,420 |
| Spanish Americans | 0.2 /100 | #277 | Tragic $75,386 |
| Osage | 0.2 /100 | #278 | Tragic $75,240 |
| Immigrants | Guatemala | 0.2 /100 | #279 | Tragic $75,123 |