Peruvian vs Immigrants from Sudan Median Household Income
COMPARE
Peruvian
Immigrants from Sudan
Median Household Income
Median Household Income Comparison
Peruvians
Immigrants from Sudan
$90,261
MEDIAN HOUSEHOLD INCOME
96.5/ 100
METRIC RATING
113th/ 347
METRIC RANK
$79,103
MEDIAN HOUSEHOLD INCOME
2.1/ 100
METRIC RATING
242nd/ 347
METRIC RANK
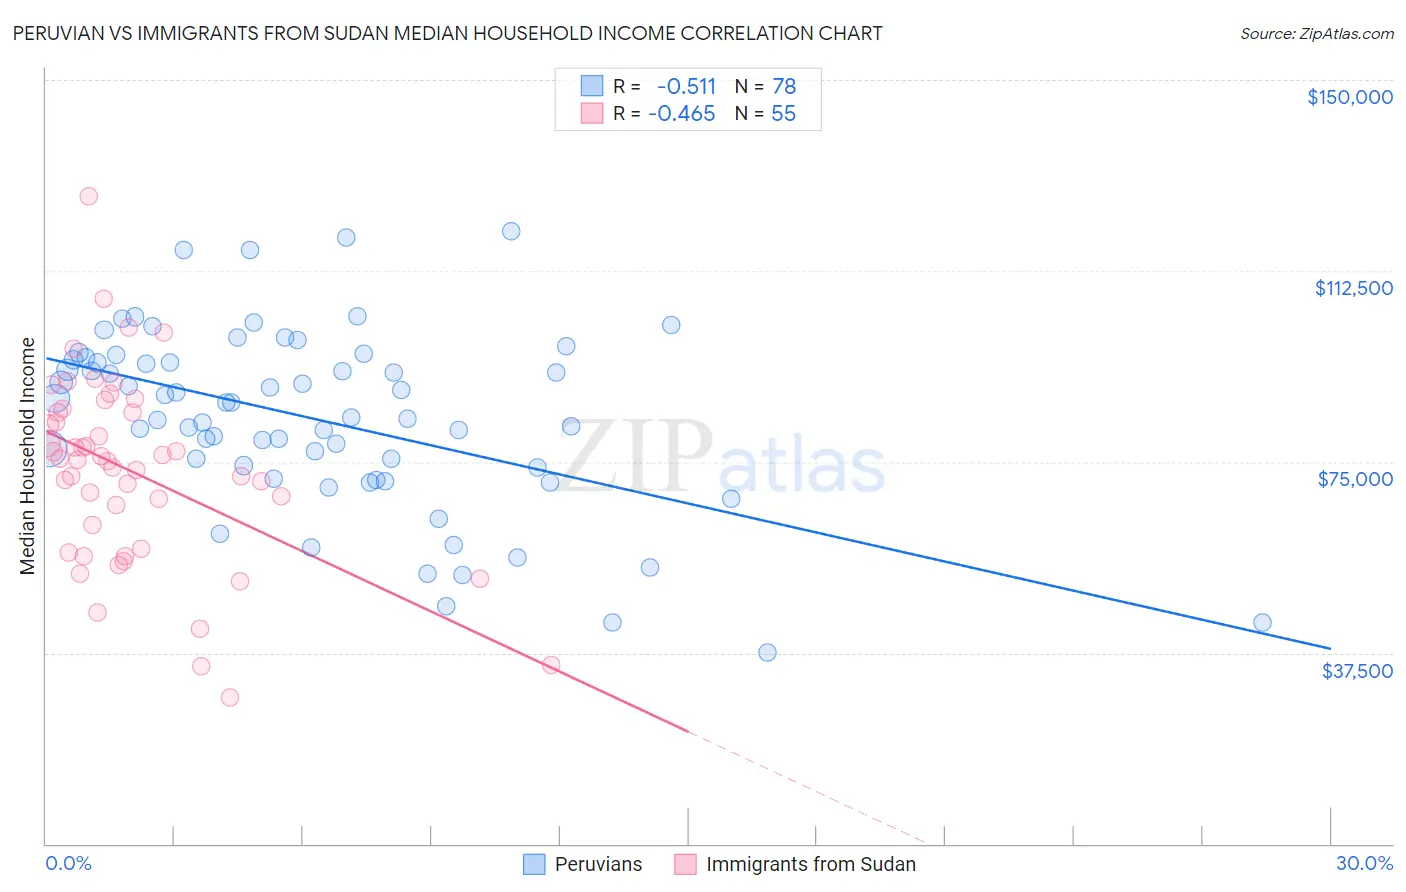
Peruvian vs Immigrants from Sudan Median Household Income Correlation Chart
The statistical analysis conducted on geographies consisting of 362,893,410 people shows a substantial negative correlation between the proportion of Peruvians and median household income in the United States with a correlation coefficient (R) of -0.511 and weighted average of $90,261. Similarly, the statistical analysis conducted on geographies consisting of 118,931,999 people shows a moderate negative correlation between the proportion of Immigrants from Sudan and median household income in the United States with a correlation coefficient (R) of -0.465 and weighted average of $79,103, a difference of 14.1%.
Median Household Income Correlation Summary
| Measurement | Peruvian | Immigrants from Sudan |
| Minimum | $37,557 | $28,750 |
| Maximum | $120,179 | $127,214 |
| Range | $82,622 | $98,464 |
| Mean | $83,404 | $73,170 |
| Median | $85,145 | $75,325 |
| Interquartile 25% (IQ1) | $73,839 | $58,025 |
| Interquartile 75% (IQ3) | $95,038 | $84,793 |
| Interquartile Range (IQR) | $21,199 | $26,769 |
| Standard Deviation (Sample) | $17,709 | $18,620 |
| Standard Deviation (Population) | $17,595 | $18,450 |
Similar Demographics by Median Household Income
Demographics Similar to Peruvians by Median Household Income
In terms of median household income, the demographic groups most similar to Peruvians are Northern European ($90,446, a difference of 0.20%), Immigrants from Northern Africa ($90,026, a difference of 0.26%), Immigrants from Western Asia ($90,005, a difference of 0.28%), Immigrants from Poland ($90,549, a difference of 0.32%), and Palestinian ($90,574, a difference of 0.35%).
| Demographics | Rating | Rank | Median Household Income |
| Macedonians | 97.4 /100 | #106 | Exceptional $90,761 |
| Croatians | 97.3 /100 | #107 | Exceptional $90,685 |
| Zimbabweans | 97.2 /100 | #108 | Exceptional $90,618 |
| Chileans | 97.2 /100 | #109 | Exceptional $90,605 |
| Palestinians | 97.1 /100 | #110 | Exceptional $90,574 |
| Immigrants | Poland | 97.1 /100 | #111 | Exceptional $90,549 |
| Northern Europeans | 96.9 /100 | #112 | Exceptional $90,446 |
| Peruvians | 96.5 /100 | #113 | Exceptional $90,261 |
| Immigrants | Northern Africa | 95.9 /100 | #114 | Exceptional $90,026 |
| Immigrants | Western Asia | 95.9 /100 | #115 | Exceptional $90,005 |
| Native Hawaiians | 95.7 /100 | #116 | Exceptional $89,919 |
| Taiwanese | 95.6 /100 | #117 | Exceptional $89,900 |
| Syrians | 95.4 /100 | #118 | Exceptional $89,830 |
| Albanians | 95.2 /100 | #119 | Exceptional $89,744 |
| Immigrants | North Macedonia | 95.2 /100 | #120 | Exceptional $89,741 |
Demographics Similar to Immigrants from Sudan by Median Household Income
In terms of median household income, the demographic groups most similar to Immigrants from Sudan are Immigrants from Barbados ($78,989, a difference of 0.14%), Marshallese ($78,930, a difference of 0.22%), Inupiat ($78,841, a difference of 0.33%), Central American ($78,803, a difference of 0.38%), and Nonimmigrants ($79,429, a difference of 0.41%).
| Demographics | Rating | Rank | Median Household Income |
| Immigrants | Guyana | 4.5 /100 | #235 | Tragic $80,324 |
| Immigrants | Bosnia and Herzegovina | 3.4 /100 | #236 | Tragic $79,888 |
| Nicaraguans | 3.1 /100 | #237 | Tragic $79,737 |
| Barbadians | 3.0 /100 | #238 | Tragic $79,664 |
| Alaska Natives | 2.7 /100 | #239 | Tragic $79,509 |
| Immigrants | Western Africa | 2.7 /100 | #240 | Tragic $79,490 |
| Immigrants | Nonimmigrants | 2.6 /100 | #241 | Tragic $79,429 |
| Immigrants | Sudan | 2.1 /100 | #242 | Tragic $79,103 |
| Immigrants | Barbados | 1.9 /100 | #243 | Tragic $78,989 |
| Marshallese | 1.9 /100 | #244 | Tragic $78,930 |
| Inupiat | 1.8 /100 | #245 | Tragic $78,841 |
| Central Americans | 1.7 /100 | #246 | Tragic $78,803 |
| Immigrants | Burma/Myanmar | 1.6 /100 | #247 | Tragic $78,682 |
| Sudanese | 1.5 /100 | #248 | Tragic $78,529 |
| West Indians | 1.4 /100 | #249 | Tragic $78,455 |