Palestinian vs Basque Median Household Income
COMPARE
Palestinian
Basque
Median Household Income
Median Household Income Comparison
Palestinians
Basques
$90,574
MEDIAN HOUSEHOLD INCOME
97.1/ 100
METRIC RATING
110th/ 347
METRIC RANK
$87,001
MEDIAN HOUSEHOLD INCOME
77.2/ 100
METRIC RATING
150th/ 347
METRIC RANK
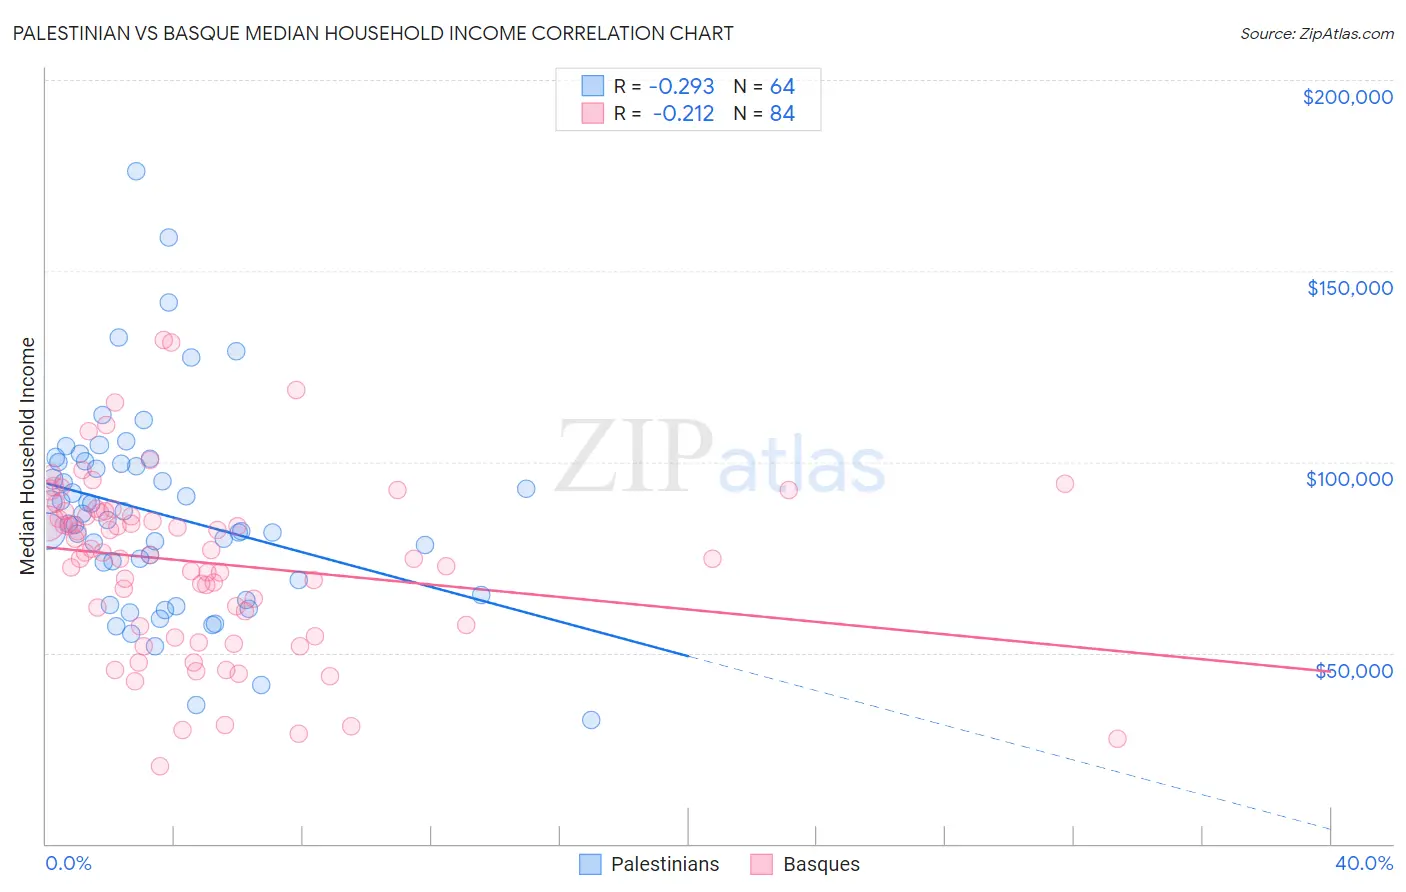
Palestinian vs Basque Median Household Income Correlation Chart
The statistical analysis conducted on geographies consisting of 216,355,198 people shows a weak negative correlation between the proportion of Palestinians and median household income in the United States with a correlation coefficient (R) of -0.293 and weighted average of $90,574. Similarly, the statistical analysis conducted on geographies consisting of 165,746,357 people shows a weak negative correlation between the proportion of Basques and median household income in the United States with a correlation coefficient (R) of -0.212 and weighted average of $87,001, a difference of 4.1%.
Median Household Income Correlation Summary
| Measurement | Palestinian | Basque |
| Minimum | $32,375 | $20,139 |
| Maximum | $176,058 | $131,838 |
| Range | $143,683 | $111,699 |
| Mean | $86,299 | $73,627 |
| Median | $84,304 | $76,033 |
| Interquartile 25% (IQ1) | $67,018 | $57,079 |
| Interquartile 75% (IQ3) | $99,711 | $86,843 |
| Interquartile Range (IQR) | $32,693 | $29,764 |
| Standard Deviation (Sample) | $26,509 | $22,838 |
| Standard Deviation (Population) | $26,301 | $22,701 |
Similar Demographics by Median Household Income
Demographics Similar to Palestinians by Median Household Income
In terms of median household income, the demographic groups most similar to Palestinians are Chilean ($90,605, a difference of 0.030%), Immigrants from Poland ($90,549, a difference of 0.030%), Zimbabwean ($90,618, a difference of 0.050%), Croatian ($90,685, a difference of 0.12%), and Northern European ($90,446, a difference of 0.14%).
| Demographics | Rating | Rank | Median Household Income |
| Immigrants | Ukraine | 98.0 /100 | #103 | Exceptional $91,124 |
| Immigrants | Kazakhstan | 97.8 /100 | #104 | Exceptional $91,015 |
| Immigrants | Brazil | 97.7 /100 | #105 | Exceptional $90,907 |
| Macedonians | 97.4 /100 | #106 | Exceptional $90,761 |
| Croatians | 97.3 /100 | #107 | Exceptional $90,685 |
| Zimbabweans | 97.2 /100 | #108 | Exceptional $90,618 |
| Chileans | 97.2 /100 | #109 | Exceptional $90,605 |
| Palestinians | 97.1 /100 | #110 | Exceptional $90,574 |
| Immigrants | Poland | 97.1 /100 | #111 | Exceptional $90,549 |
| Northern Europeans | 96.9 /100 | #112 | Exceptional $90,446 |
| Peruvians | 96.5 /100 | #113 | Exceptional $90,261 |
| Immigrants | Northern Africa | 95.9 /100 | #114 | Exceptional $90,026 |
| Immigrants | Western Asia | 95.9 /100 | #115 | Exceptional $90,005 |
| Native Hawaiians | 95.7 /100 | #116 | Exceptional $89,919 |
| Taiwanese | 95.6 /100 | #117 | Exceptional $89,900 |
Demographics Similar to Basques by Median Household Income
In terms of median household income, the demographic groups most similar to Basques are Immigrants from Nepal ($87,046, a difference of 0.050%), Hungarian ($86,920, a difference of 0.090%), Immigrants from Saudi Arabia ($86,875, a difference of 0.15%), South American ($86,824, a difference of 0.20%), and Immigrants from Germany ($86,764, a difference of 0.27%).
| Demographics | Rating | Rank | Median Household Income |
| Danes | 83.9 /100 | #143 | Excellent $87,676 |
| Serbians | 83.0 /100 | #144 | Excellent $87,572 |
| Ugandans | 82.9 /100 | #145 | Excellent $87,557 |
| Immigrants | Uganda | 82.8 /100 | #146 | Excellent $87,553 |
| South American Indians | 81.8 /100 | #147 | Excellent $87,446 |
| Costa Ricans | 80.0 /100 | #148 | Excellent $87,262 |
| Immigrants | Nepal | 77.7 /100 | #149 | Good $87,046 |
| Basques | 77.2 /100 | #150 | Good $87,001 |
| Hungarians | 76.3 /100 | #151 | Good $86,920 |
| Immigrants | Saudi Arabia | 75.8 /100 | #152 | Good $86,875 |
| South Americans | 75.1 /100 | #153 | Good $86,824 |
| Immigrants | Germany | 74.4 /100 | #154 | Good $86,764 |
| Carpatho Rusyns | 72.8 /100 | #155 | Good $86,635 |
| Immigrants | Albania | 71.5 /100 | #156 | Good $86,534 |
| Samoans | 71.0 /100 | #157 | Good $86,498 |