Austrian vs Immigrants from Lebanon Median Family Income
COMPARE
Austrian
Immigrants from Lebanon
Median Family Income
Median Family Income Comparison
Austrians
Immigrants from Lebanon
$111,306
MEDIAN FAMILY INCOME
98.8/ 100
METRIC RATING
87th/ 347
METRIC RANK
$110,159
MEDIAN FAMILY INCOME
97.9/ 100
METRIC RATING
92nd/ 347
METRIC RANK
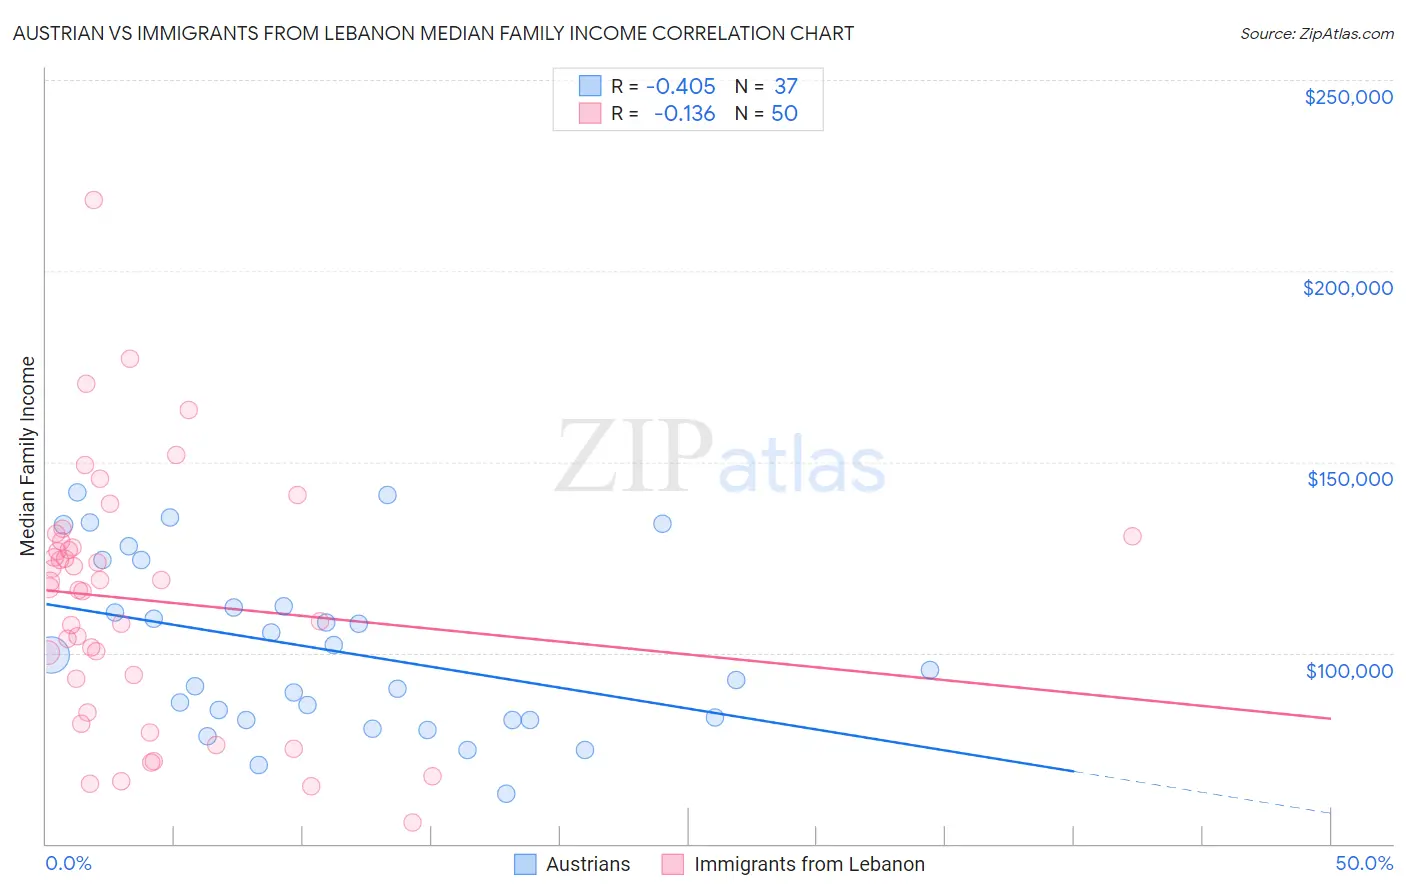
Austrian vs Immigrants from Lebanon Median Family Income Correlation Chart
The statistical analysis conducted on geographies consisting of 451,614,723 people shows a moderate negative correlation between the proportion of Austrians and median family income in the United States with a correlation coefficient (R) of -0.405 and weighted average of $111,306. Similarly, the statistical analysis conducted on geographies consisting of 217,094,496 people shows a poor negative correlation between the proportion of Immigrants from Lebanon and median family income in the United States with a correlation coefficient (R) of -0.136 and weighted average of $110,159, a difference of 1.0%.
Median Family Income Correlation Summary
| Measurement | Austrian | Immigrants from Lebanon |
| Minimum | $63,235 | $55,430 |
| Maximum | $142,142 | $218,700 |
| Range | $78,907 | $163,270 |
| Mean | $100,879 | $113,756 |
| Median | $95,625 | $117,906 |
| Interquartile 25% (IQ1) | $82,447 | $93,082 |
| Interquartile 75% (IQ3) | $118,182 | $129,106 |
| Interquartile Range (IQR) | $35,735 | $36,025 |
| Standard Deviation (Sample) | $22,141 | $32,559 |
| Standard Deviation (Population) | $21,840 | $32,232 |
Demographics Similar to Austrians and Immigrants from Lebanon by Median Family Income
In terms of median family income, the demographic groups most similar to Austrians are Immigrants from Hungary ($111,378, a difference of 0.060%), Croatian ($111,370, a difference of 0.060%), Ukrainian ($111,368, a difference of 0.060%), Romanian ($111,243, a difference of 0.060%), and Immigrants from Egypt ($111,689, a difference of 0.34%). Similarly, the demographic groups most similar to Immigrants from Lebanon are Immigrants from Kazakhstan ($110,137, a difference of 0.020%), Korean ($110,103, a difference of 0.050%), Zimbabwean ($110,011, a difference of 0.13%), Immigrants from Moldova ($109,975, a difference of 0.17%), and Jordanian ($109,865, a difference of 0.27%).
| Demographics | Rating | Rank | Median Family Income |
| Italians | 99.3 /100 | #79 | Exceptional $112,372 |
| Immigrants | Croatia | 99.3 /100 | #80 | Exceptional $112,323 |
| Immigrants | North America | 99.2 /100 | #81 | Exceptional $112,151 |
| Immigrants | England | 99.2 /100 | #82 | Exceptional $112,038 |
| Immigrants | Egypt | 99.0 /100 | #83 | Exceptional $111,689 |
| Immigrants | Hungary | 98.8 /100 | #84 | Exceptional $111,378 |
| Croatians | 98.8 /100 | #85 | Exceptional $111,370 |
| Ukrainians | 98.8 /100 | #86 | Exceptional $111,368 |
| Austrians | 98.8 /100 | #87 | Exceptional $111,306 |
| Romanians | 98.8 /100 | #88 | Exceptional $111,243 |
| Immigrants | Argentina | 98.5 /100 | #89 | Exceptional $110,873 |
| Northern Europeans | 98.3 /100 | #90 | Exceptional $110,635 |
| Immigrants | Southern Europe | 98.3 /100 | #91 | Exceptional $110,614 |
| Immigrants | Lebanon | 97.9 /100 | #92 | Exceptional $110,159 |
| Immigrants | Kazakhstan | 97.8 /100 | #93 | Exceptional $110,137 |
| Koreans | 97.8 /100 | #94 | Exceptional $110,103 |
| Zimbabweans | 97.7 /100 | #95 | Exceptional $110,011 |
| Immigrants | Moldova | 97.7 /100 | #96 | Exceptional $109,975 |
| Jordanians | 97.5 /100 | #97 | Exceptional $109,865 |
| Immigrants | Kuwait | 97.4 /100 | #98 | Exceptional $109,731 |
| Armenians | 97.3 /100 | #99 | Exceptional $109,692 |