Nigerian vs Immigrants from Denmark Per Capita Income
COMPARE
Nigerian
Immigrants from Denmark
Per Capita Income
Per Capita Income Comparison
Nigerians
Immigrants from Denmark
$41,026
PER CAPITA INCOME
4.9/ 100
METRIC RATING
229th/ 347
METRIC RANK
$53,799
PER CAPITA INCOME
100.0/ 100
METRIC RATING
24th/ 347
METRIC RANK
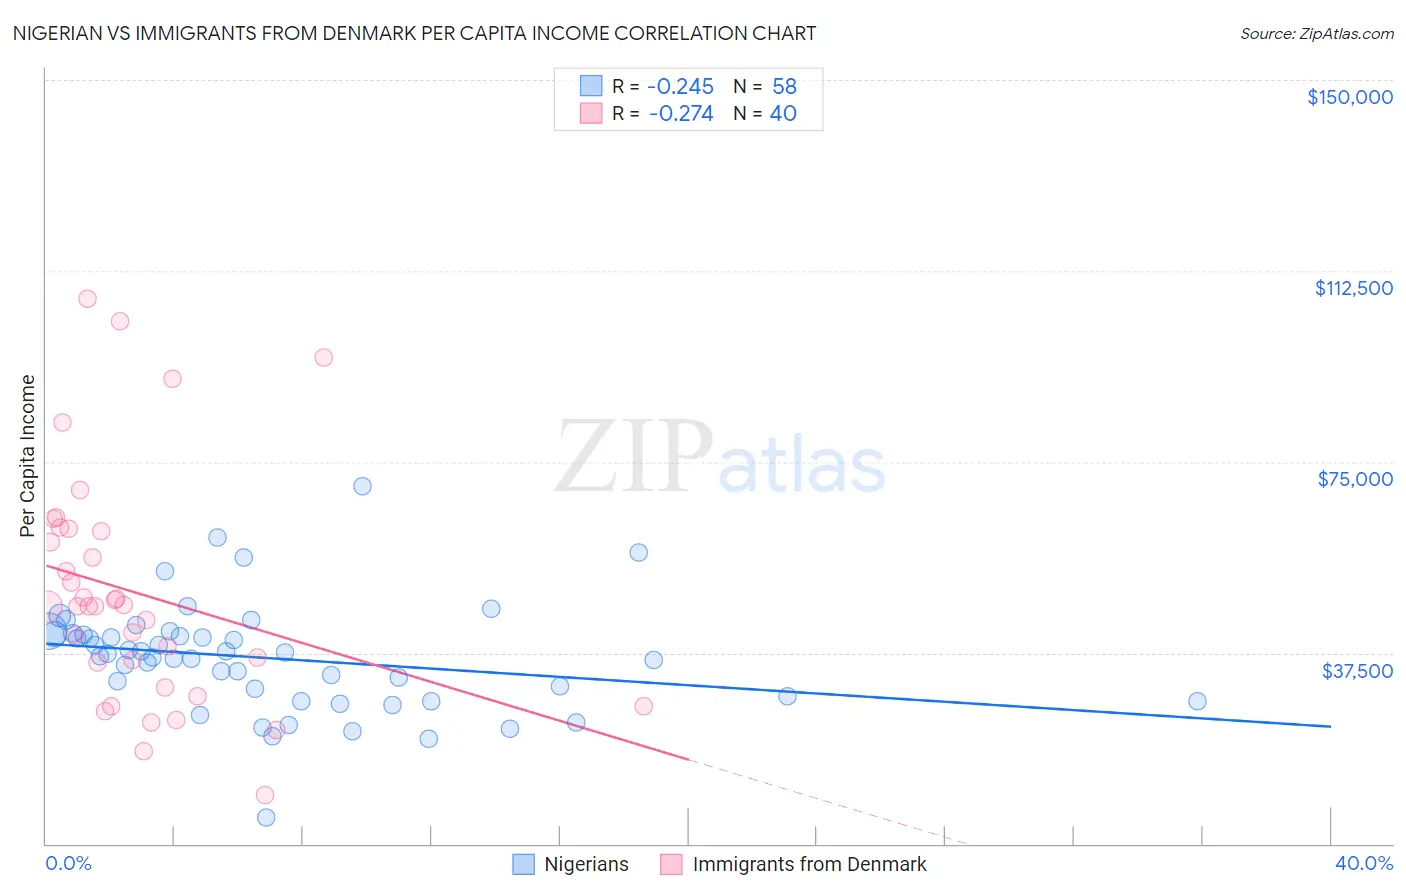
Nigerian vs Immigrants from Denmark Per Capita Income Correlation Chart
The statistical analysis conducted on geographies consisting of 332,796,588 people shows a weak negative correlation between the proportion of Nigerians and per capita income in the United States with a correlation coefficient (R) of -0.245 and weighted average of $41,026. Similarly, the statistical analysis conducted on geographies consisting of 136,433,467 people shows a weak negative correlation between the proportion of Immigrants from Denmark and per capita income in the United States with a correlation coefficient (R) of -0.274 and weighted average of $53,799, a difference of 31.1%.
Per Capita Income Correlation Summary
| Measurement | Nigerian | Immigrants from Denmark |
| Minimum | $5,085 | $9,511 |
| Maximum | $70,186 | $106,981 |
| Range | $65,101 | $97,470 |
| Mean | $36,468 | $49,281 |
| Median | $37,024 | $46,658 |
| Interquartile 25% (IQ1) | $28,928 | $33,062 |
| Interquartile 75% (IQ3) | $41,176 | $61,546 |
| Interquartile Range (IQR) | $12,248 | $28,484 |
| Standard Deviation (Sample) | $10,721 | $22,845 |
| Standard Deviation (Population) | $10,628 | $22,558 |
Similar Demographics by Per Capita Income
Demographics Similar to Nigerians by Per Capita Income
In terms of per capita income, the demographic groups most similar to Nigerians are Native Hawaiian ($41,017, a difference of 0.020%), Senegalese ($41,000, a difference of 0.060%), Guyanese ($40,949, a difference of 0.19%), Immigrants from Grenada ($41,123, a difference of 0.24%), and Immigrants from Ghana ($41,131, a difference of 0.26%).
| Demographics | Rating | Rank | Per Capita Income |
| Immigrants | Iraq | 7.1 /100 | #222 | Tragic $41,365 |
| Immigrants | Cameroon | 6.8 /100 | #223 | Tragic $41,334 |
| Immigrants | St. Vincent and the Grenadines | 6.4 /100 | #224 | Tragic $41,270 |
| West Indians | 6.0 /100 | #225 | Tragic $41,217 |
| Immigrants | Ecuador | 5.9 /100 | #226 | Tragic $41,195 |
| Immigrants | Ghana | 5.5 /100 | #227 | Tragic $41,131 |
| Immigrants | Grenada | 5.5 /100 | #228 | Tragic $41,123 |
| Nigerians | 4.9 /100 | #229 | Tragic $41,026 |
| Native Hawaiians | 4.9 /100 | #230 | Tragic $41,017 |
| Senegalese | 4.8 /100 | #231 | Tragic $41,000 |
| Guyanese | 4.5 /100 | #232 | Tragic $40,949 |
| Delaware | 3.8 /100 | #233 | Tragic $40,778 |
| Immigrants | West Indies | 3.7 /100 | #234 | Tragic $40,763 |
| Immigrants | Guyana | 3.6 /100 | #235 | Tragic $40,742 |
| Immigrants | Nonimmigrants | 3.4 /100 | #236 | Tragic $40,669 |
Demographics Similar to Immigrants from Denmark by Per Capita Income
In terms of per capita income, the demographic groups most similar to Immigrants from Denmark are Immigrants from Eastern Asia ($53,806, a difference of 0.010%), Indian (Asian) ($53,874, a difference of 0.14%), Immigrants from Northern Europe ($54,159, a difference of 0.67%), Soviet Union ($54,202, a difference of 0.75%), and Immigrants from Japan ($53,359, a difference of 0.82%).
| Demographics | Rating | Rank | Per Capita Income |
| Immigrants | France | 100.0 /100 | #17 | Exceptional $54,557 |
| Thais | 100.0 /100 | #18 | Exceptional $54,307 |
| Immigrants | China | 100.0 /100 | #19 | Exceptional $54,264 |
| Soviet Union | 100.0 /100 | #20 | Exceptional $54,202 |
| Immigrants | Northern Europe | 100.0 /100 | #21 | Exceptional $54,159 |
| Indians (Asian) | 100.0 /100 | #22 | Exceptional $53,874 |
| Immigrants | Eastern Asia | 100.0 /100 | #23 | Exceptional $53,806 |
| Immigrants | Denmark | 100.0 /100 | #24 | Exceptional $53,799 |
| Immigrants | Japan | 100.0 /100 | #25 | Exceptional $53,359 |
| Russians | 100.0 /100 | #26 | Exceptional $53,154 |
| Immigrants | South Central Asia | 100.0 /100 | #27 | Exceptional $52,660 |
| Latvians | 100.0 /100 | #28 | Exceptional $52,649 |
| Israelis | 100.0 /100 | #29 | Exceptional $52,596 |
| Immigrants | Austria | 100.0 /100 | #30 | Exceptional $52,503 |
| Turks | 100.0 /100 | #31 | Exceptional $52,391 |