Nigerian vs Immigrants from Brazil Per Capita Income

COMPARE

Nigerian
Race
Ancestry
AfghanAfricanAlaska NativeAlaskan AthabascanAlbanianAleutAlsatianAmericanApacheArabArapahoArgentineanArmenianAssyrian/Chaldean/SyriacAustralianAustrianBahamianBangladeshiBarbadianBasqueBelgianBelizeanBermudanBhutaneseBlackfeetBolivianBrazilianBritishBritish West IndianBulgarianBurmeseCajunCambodianCanadianCape VerdeanCarpatho RusynCelticCentral AmericanCentral American IndianCherokeeCheyenneChickasawChileanChineseChippewaChoctawColombianColvilleComancheCosta RicanCreeCreekCroatianCrowCubanCypriotCzechCzechoslovakianDanishDelawareDominicanDutchDutch West IndianEastern EuropeanEcuadorianEgyptianEnglishEstonianEthiopianEuropeanFijianFilipinoFinnishFrenchFrench American IndianFrench CanadianGermanGerman RussianGhanaianGreekGuamanian/ChamorroGuatemalanGuyaneseHaitianHmongHonduranHopiHoumaHungarianIcelanderIndian (Asian)IndonesianInupiatIranianIraqiIrishIroquoisIsraeliItalianJamaicanJapaneseJordanianKenyanKiowaKoreanLaotianLatvianLebaneseLiberianLithuanianLumbeeLuxembourgerMacedonianMalaysianMalteseMarshalleseMenomineeMexicanMexican American IndianMongolianMoroccanNative HawaiianNavajoNepaleseNew ZealanderNicaraguanNigerianNorthern EuropeanNorwegianOkinawanOsageOttawaPaiutePakistaniPalestinianPanamanianParaguayanPennsylvania GermanPeruvianPimaPolishPortuguesePotawatomiPuebloPuerto RicanPuget Sound SalishRomanianRussianSalvadoranSamoanScandinavianScotch-IrishScottishSeminoleSenegaleseSerbianShoshoneSierra LeoneanSiouxSlavicSlovakSloveneSomaliSouth AfricanSouth AmericanSouth American IndianSoviet UnionSpaniardSpanishSpanish AmericanSpanish American IndianSri LankanSubsaharan AfricanSudaneseSwedishSwissSyrianTaiwaneseThaiTlingit-HaidaTohono O'OdhamTonganTrinidadian and TobagonianTsimshianTurkishU.S. Virgin IslanderUgandanUkrainianUruguayanUteVenezuelanVietnameseWelshWest IndianYakamaYaquiYugoslavianYumanYup'ikZimbabwean
Immigration
NonimmigrantsImmigrantsAfghanistanAfricaAlbaniaArgentinaArmeniaAsiaAustraliaAustriaBahamasBangladeshBarbadosBelarusBelgiumBelizeBoliviaBosnia and HerzegovinaBulgariaBurma/MyanmarCabo VerdeCambodiaCameroonCanadaCaribbeanCentral AmericaChileChinaColombiaCongoCosta RicaCroatiaCubaCzechoslovakiaDenmarkDominicaDominican RepublicEastern AfricaEastern AsiaEastern EuropeEcuadorEgyptEl SalvadorEnglandEritreaEthiopiaEuropeFijiFranceGermanyGhanaGreeceGrenadaGuatemalaGuyanaHaitiHondurasHong KongHungaryIndiaIndonesiaIranIraqIrelandIsraelItalyJamaicaJapanJordanKazakhstanKenyaKoreaKuwaitLaosLatin AmericaLatviaLebanonLiberiaLithuaniaMalaysiaMexicoMicronesiaMiddle AfricaMoldovaMoroccoNepalNetherlandsNicaraguaNigeriaNorth AmericaNorth MacedoniaNorthern AfricaNorthern EuropeNorwayOceaniaPakistanPanamaPeruPhilippinesPolandPortugalRomaniaRussiaSaudi ArabiaScotlandSenegalSerbiaSierra LeoneSingaporeSomaliaSouth AfricaSouth AmericaSouth Central AsiaSouth Eastern AsiaSouthern EuropeSpainSri LankaSt. Vincent and the GrenadinesSudanSwedenSwitzerlandSyriaTaiwanThailandTrinidad and TobagoTurkeyUgandaUkraineUruguayUzbekistanVenezuelaVietnamWest IndiesWestern AfricaWestern AsiaWestern EuropeYemenZaireZimbabweAzores
Immigrants from Brazil
Race
Ancestry
AfghanAfricanAlaska NativeAlaskan AthabascanAlbanianAleutAlsatianAmericanApacheArabArapahoArgentineanArmenianAssyrian/Chaldean/SyriacAustralianAustrianBahamianBangladeshiBarbadianBasqueBelgianBelizeanBermudanBhutaneseBlackfeetBolivianBrazilianBritishBritish West IndianBulgarianBurmeseCajunCambodianCanadianCape VerdeanCarpatho RusynCelticCentral AmericanCentral American IndianCherokeeCheyenneChickasawChileanChineseChippewaChoctawColombianColvilleComancheCosta RicanCreeCreekCroatianCrowCubanCypriotCzechCzechoslovakianDanishDelawareDominicanDutchDutch West IndianEastern EuropeanEcuadorianEgyptianEnglishEstonianEthiopianEuropeanFijianFilipinoFinnishFrenchFrench American IndianFrench CanadianGermanGerman RussianGhanaianGreekGuamanian/ChamorroGuatemalanGuyaneseHaitianHmongHonduranHopiHoumaHungarianIcelanderIndian (Asian)IndonesianInupiatIranianIraqiIrishIroquoisIsraeliItalianJamaicanJapaneseJordanianKenyanKiowaKoreanLaotianLatvianLebaneseLiberianLithuanianLumbeeLuxembourgerMacedonianMalaysianMalteseMarshalleseMenomineeMexicanMexican American IndianMongolianMoroccanNative HawaiianNavajoNepaleseNew ZealanderNicaraguanNorthern EuropeanNorwegianOkinawanOsageOttawaPaiutePakistaniPalestinianPanamanianParaguayanPennsylvania GermanPeruvianPimaPolishPortuguesePotawatomiPuebloPuerto RicanPuget Sound SalishRomanianRussianSalvadoranSamoanScandinavianScotch-IrishScottishSeminoleSenegaleseSerbianShoshoneSierra LeoneanSiouxSlavicSlovakSloveneSomaliSouth AfricanSouth AmericanSouth American IndianSoviet UnionSpaniardSpanishSpanish AmericanSpanish American IndianSri LankanSubsaharan AfricanSudaneseSwedishSwissSyrianTaiwaneseThaiTlingit-HaidaTohono O'OdhamTonganTrinidadian and TobagonianTsimshianTurkishU.S. Virgin IslanderUgandanUkrainianUruguayanUteVenezuelanVietnameseWelshWest IndianYakamaYaquiYugoslavianYumanYup'ikZimbabwean
Immigration
NonimmigrantsImmigrantsAfghanistanAfricaAlbaniaArgentinaArmeniaAsiaAustraliaAustriaBahamasBangladeshBarbadosBelarusBelgiumBelizeBoliviaBosnia and HerzegovinaBrazilBulgariaBurma/MyanmarCabo VerdeCambodiaCameroonCanadaCaribbeanCentral AmericaChileChinaColombiaCongoCosta RicaCroatiaCubaCzechoslovakiaDenmarkDominicaDominican RepublicEastern AfricaEastern AsiaEastern EuropeEcuadorEgyptEl SalvadorEnglandEritreaEthiopiaEuropeFijiFranceGermanyGhanaGreeceGrenadaGuatemalaGuyanaHaitiHondurasHong KongHungaryIndiaIndonesiaIranIraqIrelandIsraelItalyJamaicaJapanJordanKazakhstanKenyaKoreaKuwaitLaosLatin AmericaLatviaLebanonLiberiaLithuaniaMalaysiaMexicoMicronesiaMiddle AfricaMoldovaMoroccoNepalNetherlandsNicaraguaNigeriaNorth AmericaNorth MacedoniaNorthern AfricaNorthern EuropeNorwayOceaniaPakistanPanamaPeruPhilippinesPolandPortugalRomaniaRussiaSaudi ArabiaScotlandSenegalSerbiaSierra LeoneSingaporeSomaliaSouth AfricaSouth AmericaSouth Central AsiaSouth Eastern AsiaSouthern EuropeSpainSri LankaSt. Vincent and the GrenadinesSudanSwedenSwitzerlandSyriaTaiwanThailandTrinidad and TobagoTurkeyUgandaUkraineUruguayUzbekistanVenezuelaVietnamWest IndiesWestern AfricaWestern AsiaWestern EuropeYemenZaireZimbabweAzores
Per Capita Income
Income
Poverty
Unemployment
Labor Participation
Family Structure
Vehicle Availability
Education Level
Disability

Per Capita Income Comparison

Nigerians

Immigrants from Brazil

Tragic
Exceptional
$41,026
PER CAPITA INCOME
4.9/ 100
METRIC RATING
229th/ 347
METRIC RANK
$48,164
PER CAPITA INCOME
99.4/ 100
METRIC RATING
83rd/ 347
METRIC RANK

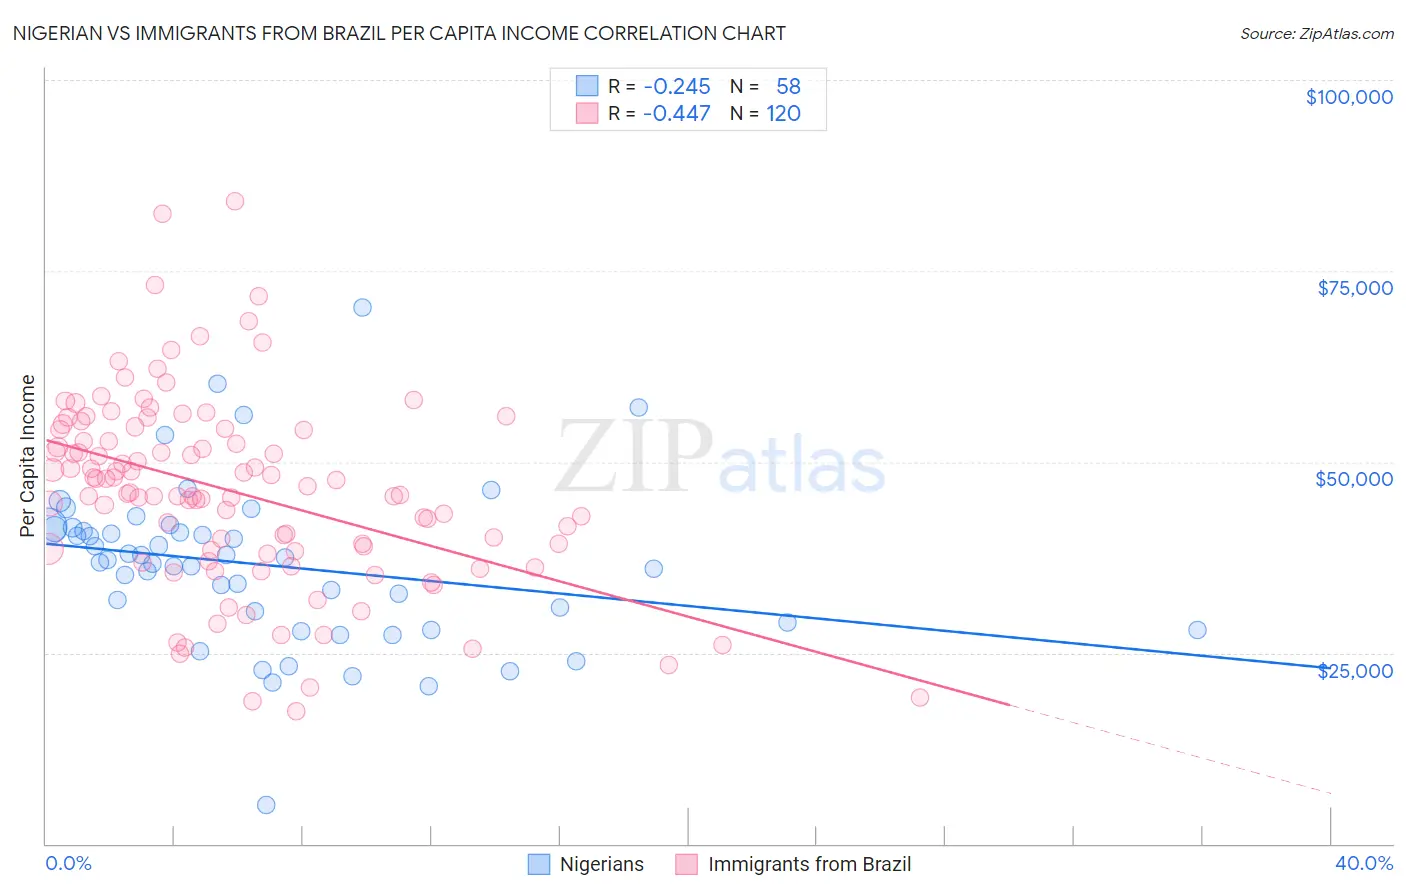
Nigerian vs Immigrants from Brazil Per Capita Income Correlation Chart

The statistical analysis conducted on geographies consisting of 332,796,588 people shows a weak negative correlation between the proportion of Nigerians and per capita income in the United States with a correlation coefficient (R) of -0.245 and weighted average of $41,026. Similarly, the statistical analysis conducted on geographies consisting of 343,026,133 people shows a moderate negative correlation between the proportion of Immigrants from Brazil and per capita income in the United States with a correlation coefficient (R) of -0.447 and weighted average of $48,164, a difference of 17.4%.
Nigerian vs Immigrants from Brazil Per Capita Income

Per Capita Income Correlation Summary

MeasurementNigerianImmigrants from Brazil
Minimum$5,085$17,376
Maximum$70,186$84,094
Range$65,101$66,718
Mean$36,468$46,035
Median$37,024$45,902
Interquartile 25% (IQ1)$28,928$38,349
Interquartile 75% (IQ3)$41,176$54,171
Interquartile Range (IQR)$12,248$15,822
Standard Deviation (Sample)$10,721$12,485
Standard Deviation (Population)$10,628$12,433

Similar Demographics by Per Capita Income

Demographics Similar to Nigerians by Per Capita Income

In terms of per capita income, the demographic groups most similar to Nigerians are Native Hawaiian ($41,017, a difference of 0.020%), Senegalese ($41,000, a difference of 0.060%), Guyanese ($40,949, a difference of 0.19%), Immigrants from Grenada ($41,123, a difference of 0.24%), and Immigrants from Ghana ($41,131, a difference of 0.26%).
DemographicsRating | RankPer Capita Income
Immigrants | Iraq
7.1
/100
|
#222
Tragic
$41,365
Immigrants | Cameroon
6.8
/100
|
#223
Tragic
$41,334
Immigrants | St. Vincent and the Grenadines
6.4
/100
|
#224
Tragic
$41,270
West Indians
6.0
/100
|
#225
Tragic
$41,217
Immigrants | Ecuador
5.9
/100
|
#226
Tragic
$41,195
Immigrants | Ghana
5.5
/100
|
#227
Tragic
$41,131
Immigrants | Grenada
5.5
/100
|
#228
Tragic
$41,123
Nigerians
4.9
/100
|
#229
Tragic
$41,026
Native Hawaiians
4.9
/100
|
#230
Tragic
$41,017
Senegalese
4.8
/100
|
#231
Tragic
$41,000
Guyanese
4.5
/100
|
#232
Tragic
$40,949
Delaware
3.8
/100
|
#233
Tragic
$40,778
Immigrants | West Indies
3.7
/100
|
#234
Tragic
$40,763
Immigrants | Guyana
3.6
/100
|
#235
Tragic
$40,742
Immigrants | Nonimmigrants
3.4
/100
|
#236
Tragic
$40,669

Demographics Similar to Immigrants from Brazil by Per Capita Income

In terms of per capita income, the demographic groups most similar to Immigrants from Brazil are Immigrants from Indonesia ($48,195, a difference of 0.060%), Immigrants from Ukraine ($48,134, a difference of 0.060%), Austrian ($48,116, a difference of 0.10%), Armenian ($48,287, a difference of 0.26%), and Immigrants from Southern Europe ($48,027, a difference of 0.29%).
DemographicsRating | RankPer Capita Income
Immigrants | England
99.7
/100
|
#76
Exceptional
$48,844
Immigrants | Kazakhstan
99.7
/100
|
#77
Exceptional
$48,747
Immigrants | Italy
99.6
/100
|
#78
Exceptional
$48,654
Romanians
99.5
/100
|
#79
Exceptional
$48,445
Egyptians
99.5
/100
|
#80
Exceptional
$48,358
Armenians
99.4
/100
|
#81
Exceptional
$48,287
Immigrants | Indonesia
99.4
/100
|
#82
Exceptional
$48,195
Immigrants | Brazil
99.4
/100
|
#83
Exceptional
$48,164
Immigrants | Ukraine
99.3
/100
|
#84
Exceptional
$48,134
Austrians
99.3
/100
|
#85
Exceptional
$48,116
Immigrants | Southern Europe
99.3
/100
|
#86
Exceptional
$48,027
Ukrainians
99.3
/100
|
#87
Exceptional
$48,014
Croatians
99.0
/100
|
#88
Exceptional
$47,742
Northern Europeans
98.9
/100
|
#89
Exceptional
$47,698
Italians
98.8
/100
|
#90
Exceptional
$47,574