Cape Verdean vs Immigrants from Denmark Per Capita Income
COMPARE
Cape Verdean
Immigrants from Denmark
Per Capita Income
Per Capita Income Comparison
Cape Verdeans
Immigrants from Denmark
$39,935
PER CAPITA INCOME
1.5/ 100
METRIC RATING
248th/ 347
METRIC RANK
$53,799
PER CAPITA INCOME
100.0/ 100
METRIC RATING
24th/ 347
METRIC RANK
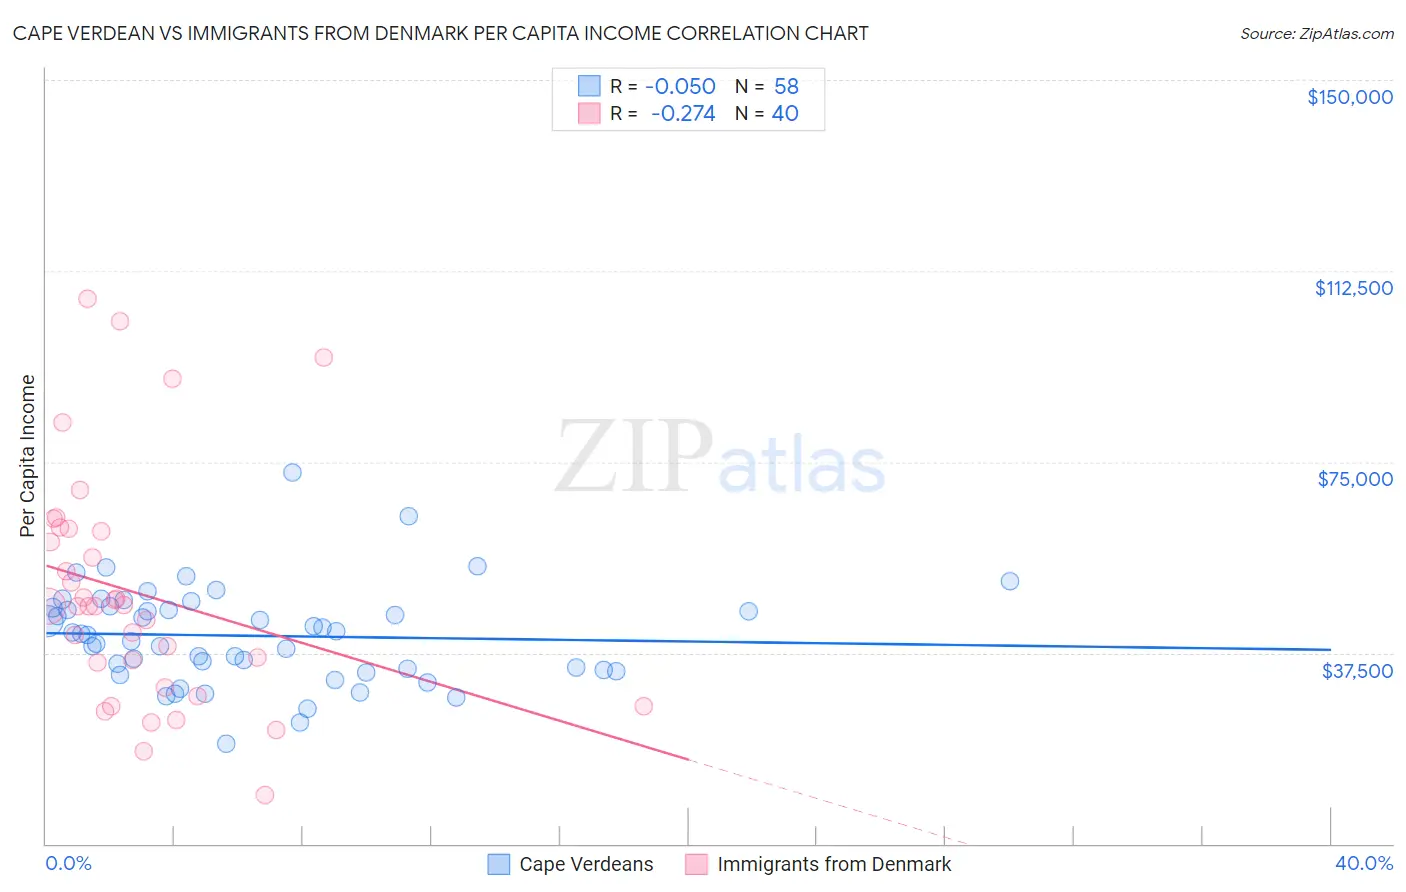
Cape Verdean vs Immigrants from Denmark Per Capita Income Correlation Chart
The statistical analysis conducted on geographies consisting of 107,581,213 people shows no correlation between the proportion of Cape Verdeans and per capita income in the United States with a correlation coefficient (R) of -0.050 and weighted average of $39,935. Similarly, the statistical analysis conducted on geographies consisting of 136,433,467 people shows a weak negative correlation between the proportion of Immigrants from Denmark and per capita income in the United States with a correlation coefficient (R) of -0.274 and weighted average of $53,799, a difference of 34.7%.
Per Capita Income Correlation Summary
| Measurement | Cape Verdean | Immigrants from Denmark |
| Minimum | $19,552 | $9,511 |
| Maximum | $72,967 | $106,981 |
| Range | $53,415 | $97,470 |
| Mean | $40,842 | $49,281 |
| Median | $41,136 | $46,658 |
| Interquartile 25% (IQ1) | $34,180 | $33,062 |
| Interquartile 75% (IQ3) | $46,319 | $61,546 |
| Interquartile Range (IQR) | $12,139 | $28,484 |
| Standard Deviation (Sample) | $9,616 | $22,845 |
| Standard Deviation (Population) | $9,533 | $22,558 |
Similar Demographics by Per Capita Income
Demographics Similar to Cape Verdeans by Per Capita Income
In terms of per capita income, the demographic groups most similar to Cape Verdeans are Immigrants from Somalia ($39,974, a difference of 0.10%), Japanese ($39,870, a difference of 0.16%), Immigrants from Burma/Myanmar ($39,827, a difference of 0.27%), Samoan ($39,826, a difference of 0.27%), and Cree ($40,056, a difference of 0.30%).
| Demographics | Rating | Rank | Per Capita Income |
| British West Indians | 2.3 /100 | #241 | Tragic $40,330 |
| Immigrants | Western Africa | 2.2 /100 | #242 | Tragic $40,294 |
| German Russians | 2.2 /100 | #243 | Tragic $40,266 |
| French American Indians | 2.1 /100 | #244 | Tragic $40,244 |
| Sub-Saharan Africans | 1.9 /100 | #245 | Tragic $40,152 |
| Cree | 1.7 /100 | #246 | Tragic $40,056 |
| Immigrants | Somalia | 1.6 /100 | #247 | Tragic $39,974 |
| Cape Verdeans | 1.5 /100 | #248 | Tragic $39,935 |
| Japanese | 1.4 /100 | #249 | Tragic $39,870 |
| Immigrants | Burma/Myanmar | 1.3 /100 | #250 | Tragic $39,827 |
| Samoans | 1.3 /100 | #251 | Tragic $39,826 |
| Immigrants | Azores | 1.0 /100 | #252 | Tragic $39,608 |
| Osage | 1.0 /100 | #253 | Tragic $39,568 |
| Alaska Natives | 1.0 /100 | #254 | Tragic $39,558 |
| Immigrants | Middle Africa | 1.0 /100 | #255 | Tragic $39,529 |
Demographics Similar to Immigrants from Denmark by Per Capita Income
In terms of per capita income, the demographic groups most similar to Immigrants from Denmark are Immigrants from Eastern Asia ($53,806, a difference of 0.010%), Indian (Asian) ($53,874, a difference of 0.14%), Immigrants from Northern Europe ($54,159, a difference of 0.67%), Soviet Union ($54,202, a difference of 0.75%), and Immigrants from Japan ($53,359, a difference of 0.82%).
| Demographics | Rating | Rank | Per Capita Income |
| Immigrants | France | 100.0 /100 | #17 | Exceptional $54,557 |
| Thais | 100.0 /100 | #18 | Exceptional $54,307 |
| Immigrants | China | 100.0 /100 | #19 | Exceptional $54,264 |
| Soviet Union | 100.0 /100 | #20 | Exceptional $54,202 |
| Immigrants | Northern Europe | 100.0 /100 | #21 | Exceptional $54,159 |
| Indians (Asian) | 100.0 /100 | #22 | Exceptional $53,874 |
| Immigrants | Eastern Asia | 100.0 /100 | #23 | Exceptional $53,806 |
| Immigrants | Denmark | 100.0 /100 | #24 | Exceptional $53,799 |
| Immigrants | Japan | 100.0 /100 | #25 | Exceptional $53,359 |
| Russians | 100.0 /100 | #26 | Exceptional $53,154 |
| Immigrants | South Central Asia | 100.0 /100 | #27 | Exceptional $52,660 |
| Latvians | 100.0 /100 | #28 | Exceptional $52,649 |
| Israelis | 100.0 /100 | #29 | Exceptional $52,596 |
| Immigrants | Austria | 100.0 /100 | #30 | Exceptional $52,503 |
| Turks | 100.0 /100 | #31 | Exceptional $52,391 |