Nigerian vs Immigrants from Congo Per Capita Income
COMPARE
Nigerian
Immigrants from Congo
Per Capita Income
Per Capita Income Comparison
Nigerians
Immigrants from Congo
$41,026
PER CAPITA INCOME
4.9/ 100
METRIC RATING
229th/ 347
METRIC RANK
$35,720
PER CAPITA INCOME
0.0/ 100
METRIC RATING
319th/ 347
METRIC RANK
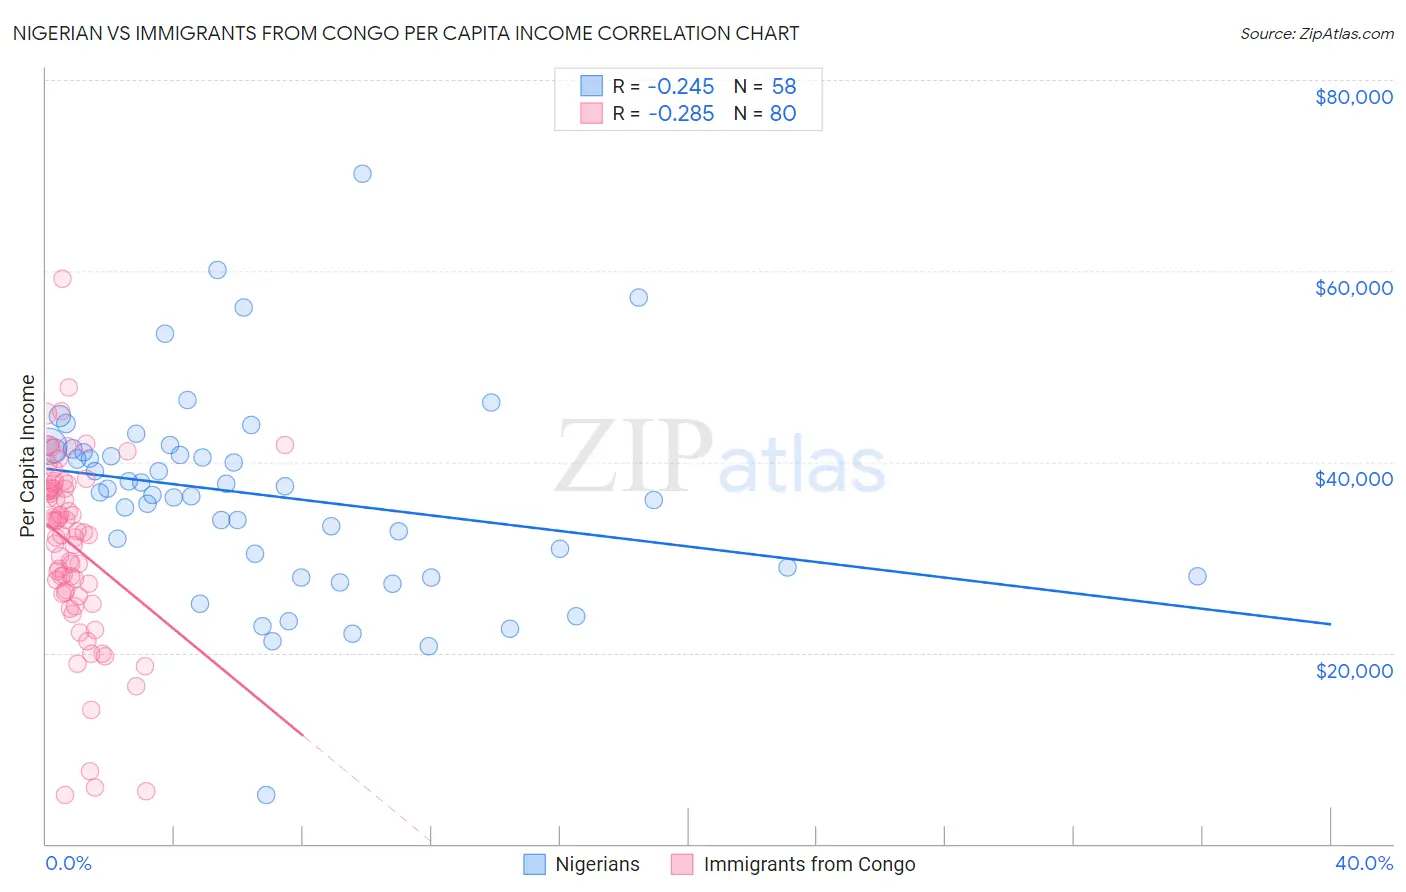
Nigerian vs Immigrants from Congo Per Capita Income Correlation Chart
The statistical analysis conducted on geographies consisting of 332,796,588 people shows a weak negative correlation between the proportion of Nigerians and per capita income in the United States with a correlation coefficient (R) of -0.245 and weighted average of $41,026. Similarly, the statistical analysis conducted on geographies consisting of 92,126,617 people shows a weak negative correlation between the proportion of Immigrants from Congo and per capita income in the United States with a correlation coefficient (R) of -0.285 and weighted average of $35,720, a difference of 14.8%.
Per Capita Income Correlation Summary
| Measurement | Nigerian | Immigrants from Congo |
| Minimum | $5,085 | $5,075 |
| Maximum | $70,186 | $59,125 |
| Range | $65,101 | $54,050 |
| Mean | $36,468 | $31,172 |
| Median | $37,024 | $32,475 |
| Interquartile 25% (IQ1) | $28,928 | $26,293 |
| Interquartile 75% (IQ3) | $41,176 | $37,243 |
| Interquartile Range (IQR) | $12,248 | $10,950 |
| Standard Deviation (Sample) | $10,721 | $9,699 |
| Standard Deviation (Population) | $10,628 | $9,639 |
Similar Demographics by Per Capita Income
Demographics Similar to Nigerians by Per Capita Income
In terms of per capita income, the demographic groups most similar to Nigerians are Native Hawaiian ($41,017, a difference of 0.020%), Senegalese ($41,000, a difference of 0.060%), Guyanese ($40,949, a difference of 0.19%), Immigrants from Grenada ($41,123, a difference of 0.24%), and Immigrants from Ghana ($41,131, a difference of 0.26%).
| Demographics | Rating | Rank | Per Capita Income |
| Immigrants | Iraq | 7.1 /100 | #222 | Tragic $41,365 |
| Immigrants | Cameroon | 6.8 /100 | #223 | Tragic $41,334 |
| Immigrants | St. Vincent and the Grenadines | 6.4 /100 | #224 | Tragic $41,270 |
| West Indians | 6.0 /100 | #225 | Tragic $41,217 |
| Immigrants | Ecuador | 5.9 /100 | #226 | Tragic $41,195 |
| Immigrants | Ghana | 5.5 /100 | #227 | Tragic $41,131 |
| Immigrants | Grenada | 5.5 /100 | #228 | Tragic $41,123 |
| Nigerians | 4.9 /100 | #229 | Tragic $41,026 |
| Native Hawaiians | 4.9 /100 | #230 | Tragic $41,017 |
| Senegalese | 4.8 /100 | #231 | Tragic $41,000 |
| Guyanese | 4.5 /100 | #232 | Tragic $40,949 |
| Delaware | 3.8 /100 | #233 | Tragic $40,778 |
| Immigrants | West Indies | 3.7 /100 | #234 | Tragic $40,763 |
| Immigrants | Guyana | 3.6 /100 | #235 | Tragic $40,742 |
| Immigrants | Nonimmigrants | 3.4 /100 | #236 | Tragic $40,669 |
Demographics Similar to Immigrants from Congo by Per Capita Income
In terms of per capita income, the demographic groups most similar to Immigrants from Congo are Hispanic or Latino ($35,688, a difference of 0.090%), Black/African American ($35,564, a difference of 0.44%), Creek ($35,546, a difference of 0.49%), Bangladeshi ($35,897, a difference of 0.50%), and Dutch West Indian ($35,922, a difference of 0.57%).
| Demographics | Rating | Rank | Per Capita Income |
| Chickasaw | 0.0 /100 | #312 | Tragic $36,475 |
| Bahamians | 0.0 /100 | #313 | Tragic $36,427 |
| Seminole | 0.0 /100 | #314 | Tragic $36,180 |
| Yaqui | 0.0 /100 | #315 | Tragic $36,112 |
| Choctaw | 0.0 /100 | #316 | Tragic $35,999 |
| Dutch West Indians | 0.0 /100 | #317 | Tragic $35,922 |
| Bangladeshis | 0.0 /100 | #318 | Tragic $35,897 |
| Immigrants | Congo | 0.0 /100 | #319 | Tragic $35,720 |
| Hispanics or Latinos | 0.0 /100 | #320 | Tragic $35,688 |
| Blacks/African Americans | 0.0 /100 | #321 | Tragic $35,564 |
| Creek | 0.0 /100 | #322 | Tragic $35,546 |
| Cheyenne | 0.0 /100 | #323 | Tragic $35,276 |
| Kiowa | 0.0 /100 | #324 | Tragic $35,102 |
| Immigrants | Central America | 0.0 /100 | #325 | Tragic $34,974 |
| Immigrants | Cuba | 0.0 /100 | #326 | Tragic $34,910 |