Nepalese vs Immigrants from Indonesia Median Household Income
COMPARE
Nepalese
Immigrants from Indonesia
Median Household Income
Median Household Income Comparison
Nepalese
Immigrants from Indonesia
$82,410
MEDIAN HOUSEHOLD INCOME
15.1/ 100
METRIC RATING
213th/ 347
METRIC RANK
$97,297
MEDIAN HOUSEHOLD INCOME
100.0/ 100
METRIC RATING
38th/ 347
METRIC RANK
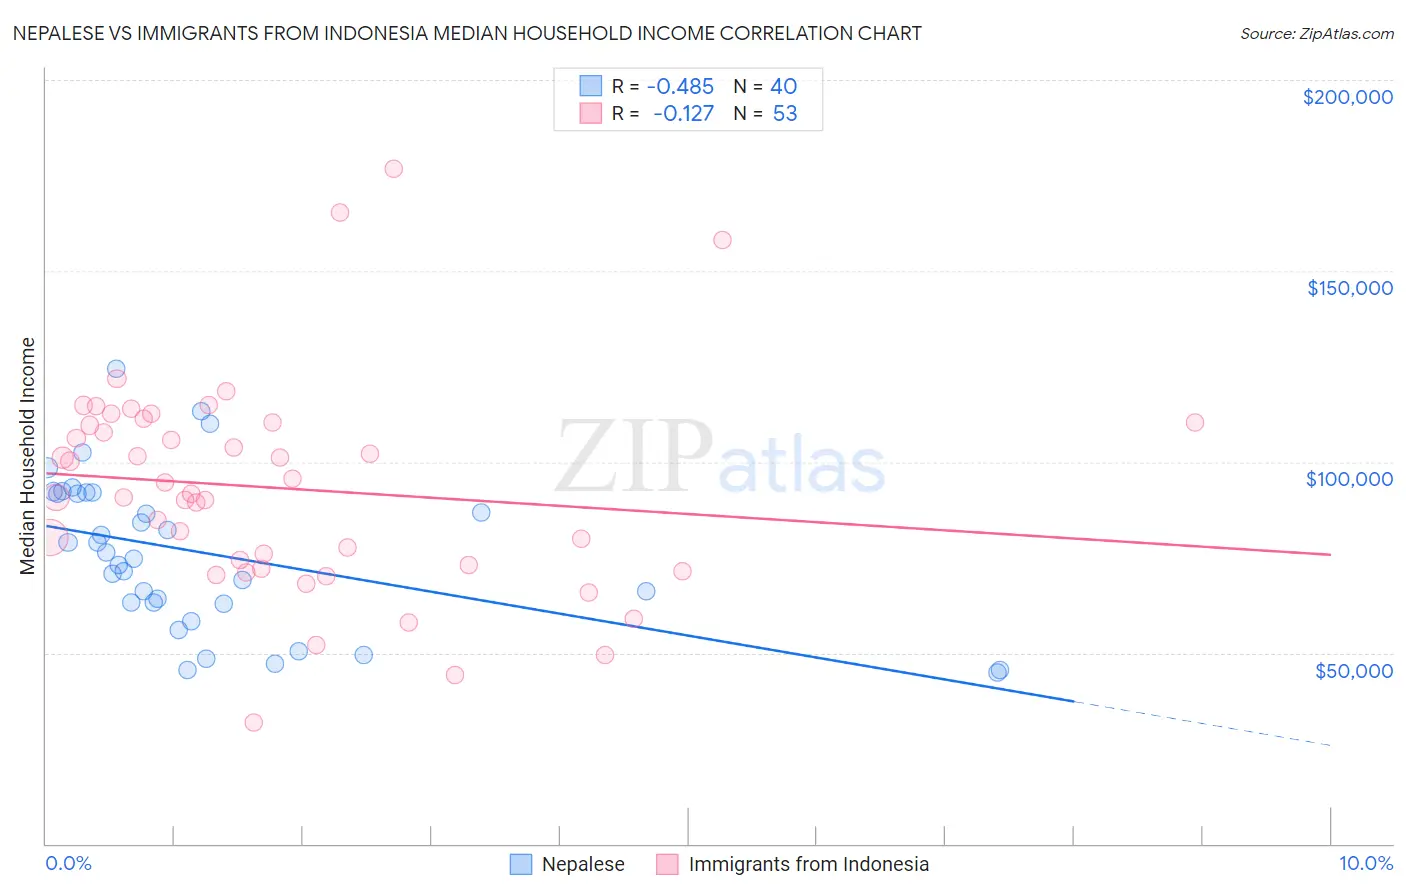
Nepalese vs Immigrants from Indonesia Median Household Income Correlation Chart
The statistical analysis conducted on geographies consisting of 24,521,755 people shows a moderate negative correlation between the proportion of Nepalese and median household income in the United States with a correlation coefficient (R) of -0.485 and weighted average of $82,410. Similarly, the statistical analysis conducted on geographies consisting of 215,679,873 people shows a poor negative correlation between the proportion of Immigrants from Indonesia and median household income in the United States with a correlation coefficient (R) of -0.127 and weighted average of $97,297, a difference of 18.1%.
Median Household Income Correlation Summary
| Measurement | Nepalese | Immigrants from Indonesia |
| Minimum | $45,000 | $31,861 |
| Maximum | $124,273 | $176,702 |
| Range | $79,273 | $144,840 |
| Mean | $75,935 | $93,146 |
| Median | $75,316 | $91,574 |
| Interquartile 25% (IQ1) | $63,001 | $72,477 |
| Interquartile 75% (IQ3) | $91,848 | $110,341 |
| Interquartile Range (IQR) | $28,847 | $37,864 |
| Standard Deviation (Sample) | $20,077 | $27,918 |
| Standard Deviation (Population) | $19,825 | $27,654 |
Similar Demographics by Median Household Income
Demographics Similar to Nepalese by Median Household Income
In terms of median household income, the demographic groups most similar to Nepalese are Venezuelan ($82,432, a difference of 0.030%), Salvadoran ($82,449, a difference of 0.050%), Panamanian ($82,272, a difference of 0.17%), Immigrants from Uruguay ($82,560, a difference of 0.18%), and Vietnamese ($82,248, a difference of 0.20%).
| Demographics | Rating | Rank | Median Household Income |
| Immigrants | Kenya | 21.3 /100 | #206 | Fair $83,068 |
| Dutch | 20.3 /100 | #207 | Fair $82,971 |
| French Canadians | 18.7 /100 | #208 | Poor $82,810 |
| Immigrants | Iraq | 16.7 /100 | #209 | Poor $82,594 |
| Immigrants | Uruguay | 16.4 /100 | #210 | Poor $82,560 |
| Salvadorans | 15.4 /100 | #211 | Poor $82,449 |
| Venezuelans | 15.3 /100 | #212 | Poor $82,432 |
| Nepalese | 15.1 /100 | #213 | Poor $82,410 |
| Panamanians | 14.0 /100 | #214 | Poor $82,272 |
| Vietnamese | 13.8 /100 | #215 | Poor $82,248 |
| Yugoslavians | 13.3 /100 | #216 | Poor $82,186 |
| Ecuadorians | 12.5 /100 | #217 | Poor $82,070 |
| Whites/Caucasians | 12.2 /100 | #218 | Poor $82,029 |
| Nigerians | 10.3 /100 | #219 | Poor $81,725 |
| Immigrants | Venezuela | 9.0 /100 | #220 | Tragic $81,506 |
Demographics Similar to Immigrants from Indonesia by Median Household Income
In terms of median household income, the demographic groups most similar to Immigrants from Indonesia are Latvian ($97,311, a difference of 0.010%), Immigrants from Pakistan ($97,528, a difference of 0.24%), Afghan ($97,026, a difference of 0.28%), Maltese ($97,015, a difference of 0.29%), and Immigrants from Turkey ($96,964, a difference of 0.34%).
| Demographics | Rating | Rank | Median Household Income |
| Turks | 100.0 /100 | #31 | Exceptional $99,389 |
| Immigrants | Denmark | 100.0 /100 | #32 | Exceptional $98,510 |
| Chinese | 100.0 /100 | #33 | Exceptional $98,496 |
| Russians | 100.0 /100 | #34 | Exceptional $98,008 |
| Immigrants | Switzerland | 100.0 /100 | #35 | Exceptional $97,979 |
| Immigrants | Pakistan | 100.0 /100 | #36 | Exceptional $97,528 |
| Latvians | 100.0 /100 | #37 | Exceptional $97,311 |
| Immigrants | Indonesia | 100.0 /100 | #38 | Exceptional $97,297 |
| Afghans | 100.0 /100 | #39 | Exceptional $97,026 |
| Maltese | 100.0 /100 | #40 | Exceptional $97,015 |
| Immigrants | Turkey | 100.0 /100 | #41 | Exceptional $96,964 |
| Immigrants | Lithuania | 99.9 /100 | #42 | Exceptional $96,836 |
| Immigrants | France | 99.9 /100 | #43 | Exceptional $96,743 |
| Immigrants | Greece | 99.9 /100 | #44 | Exceptional $96,675 |
| Israelis | 99.9 /100 | #45 | Exceptional $96,552 |