Israeli vs Immigrants from Indonesia Median Household Income
COMPARE
Israeli
Immigrants from Indonesia
Median Household Income
Median Household Income Comparison
Israelis
Immigrants from Indonesia
$96,552
MEDIAN HOUSEHOLD INCOME
99.9/ 100
METRIC RATING
45th/ 347
METRIC RANK
$97,297
MEDIAN HOUSEHOLD INCOME
100.0/ 100
METRIC RATING
38th/ 347
METRIC RANK
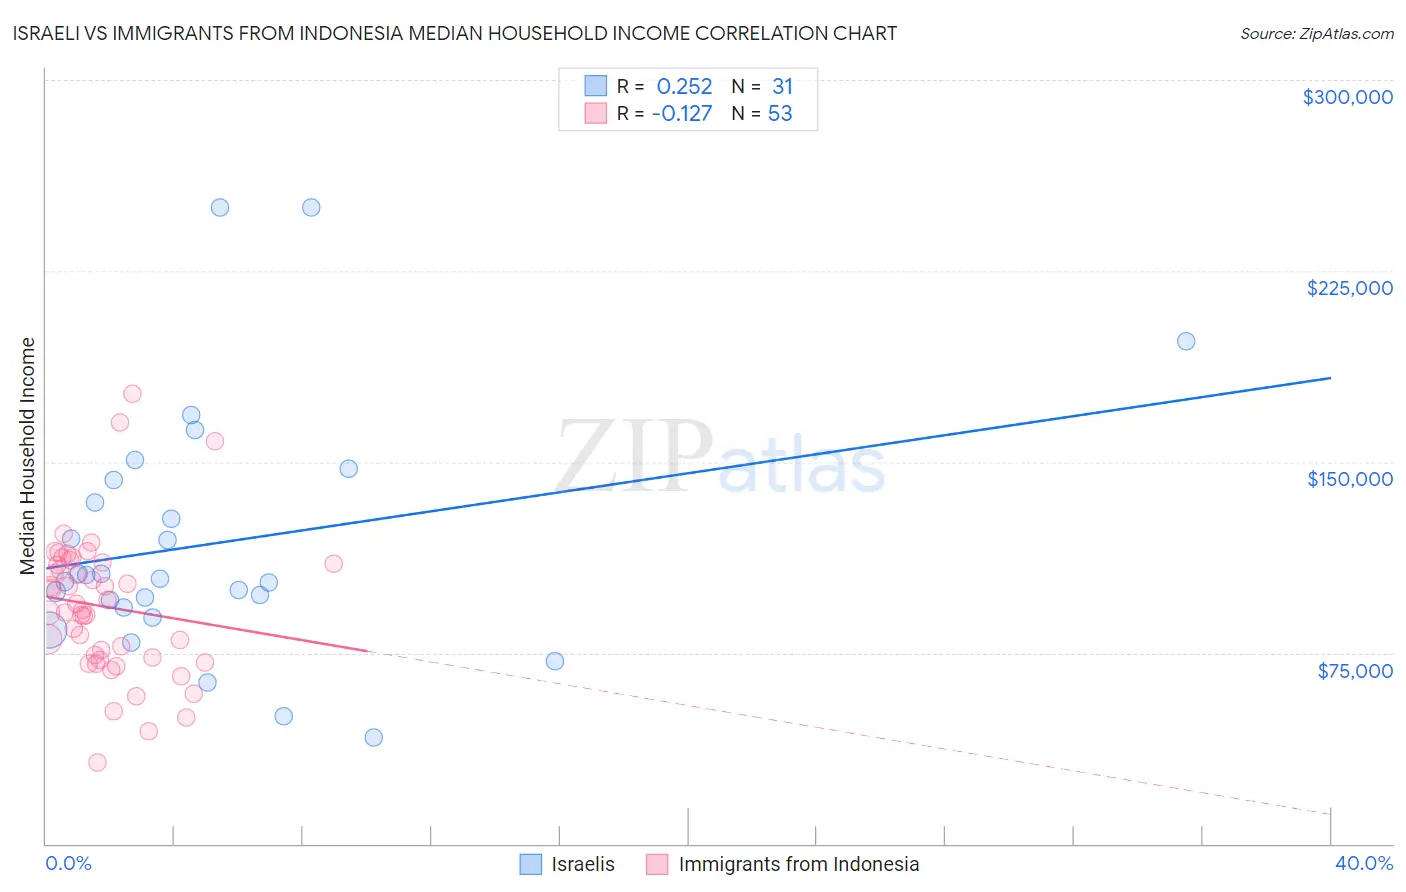
Israeli vs Immigrants from Indonesia Median Household Income Correlation Chart
The statistical analysis conducted on geographies consisting of 210,971,551 people shows a weak positive correlation between the proportion of Israelis and median household income in the United States with a correlation coefficient (R) of 0.252 and weighted average of $96,552. Similarly, the statistical analysis conducted on geographies consisting of 215,679,873 people shows a poor negative correlation between the proportion of Immigrants from Indonesia and median household income in the United States with a correlation coefficient (R) of -0.127 and weighted average of $97,297, a difference of 0.77%.
Median Household Income Correlation Summary
| Measurement | Israeli | Immigrants from Indonesia |
| Minimum | $41,875 | $31,861 |
| Maximum | $250,001 | $176,702 |
| Range | $208,126 | $144,840 |
| Mean | $117,996 | $93,146 |
| Median | $104,190 | $91,574 |
| Interquartile 25% (IQ1) | $92,986 | $72,477 |
| Interquartile 75% (IQ3) | $142,824 | $110,341 |
| Interquartile Range (IQR) | $49,838 | $37,864 |
| Standard Deviation (Sample) | $48,790 | $27,918 |
| Standard Deviation (Population) | $47,997 | $27,654 |
Demographics Similar to Israelis and Immigrants from Indonesia by Median Household Income
In terms of median household income, the demographic groups most similar to Israelis are Australian ($96,490, a difference of 0.060%), Immigrants from Greece ($96,675, a difference of 0.13%), Immigrants from Russia ($96,378, a difference of 0.18%), Immigrants from France ($96,743, a difference of 0.20%), and Cambodian ($96,324, a difference of 0.24%). Similarly, the demographic groups most similar to Immigrants from Indonesia are Latvian ($97,311, a difference of 0.010%), Immigrants from Pakistan ($97,528, a difference of 0.24%), Afghan ($97,026, a difference of 0.28%), Maltese ($97,015, a difference of 0.29%), and Immigrants from Turkey ($96,964, a difference of 0.34%).
| Demographics | Rating | Rank | Median Household Income |
| Turks | 100.0 /100 | #31 | Exceptional $99,389 |
| Immigrants | Denmark | 100.0 /100 | #32 | Exceptional $98,510 |
| Chinese | 100.0 /100 | #33 | Exceptional $98,496 |
| Russians | 100.0 /100 | #34 | Exceptional $98,008 |
| Immigrants | Switzerland | 100.0 /100 | #35 | Exceptional $97,979 |
| Immigrants | Pakistan | 100.0 /100 | #36 | Exceptional $97,528 |
| Latvians | 100.0 /100 | #37 | Exceptional $97,311 |
| Immigrants | Indonesia | 100.0 /100 | #38 | Exceptional $97,297 |
| Afghans | 100.0 /100 | #39 | Exceptional $97,026 |
| Maltese | 100.0 /100 | #40 | Exceptional $97,015 |
| Immigrants | Turkey | 100.0 /100 | #41 | Exceptional $96,964 |
| Immigrants | Lithuania | 99.9 /100 | #42 | Exceptional $96,836 |
| Immigrants | France | 99.9 /100 | #43 | Exceptional $96,743 |
| Immigrants | Greece | 99.9 /100 | #44 | Exceptional $96,675 |
| Israelis | 99.9 /100 | #45 | Exceptional $96,552 |
| Australians | 99.9 /100 | #46 | Exceptional $96,490 |
| Immigrants | Russia | 99.9 /100 | #47 | Exceptional $96,378 |
| Cambodians | 99.9 /100 | #48 | Exceptional $96,324 |
| Immigrants | Malaysia | 99.9 /100 | #49 | Exceptional $96,292 |
| Bulgarians | 99.9 /100 | #50 | Exceptional $96,290 |
| Estonians | 99.9 /100 | #51 | Exceptional $95,930 |