Nepalese vs Assyrian/Chaldean/Syriac Median Household Income
COMPARE
Nepalese
Assyrian/Chaldean/Syriac
Median Household Income
Median Household Income Comparison
Nepalese
Assyrians/Chaldeans/Syriacs
$82,410
MEDIAN HOUSEHOLD INCOME
15.1/ 100
METRIC RATING
213th/ 347
METRIC RANK
$91,991
MEDIAN HOUSEHOLD INCOME
98.8/ 100
METRIC RATING
90th/ 347
METRIC RANK
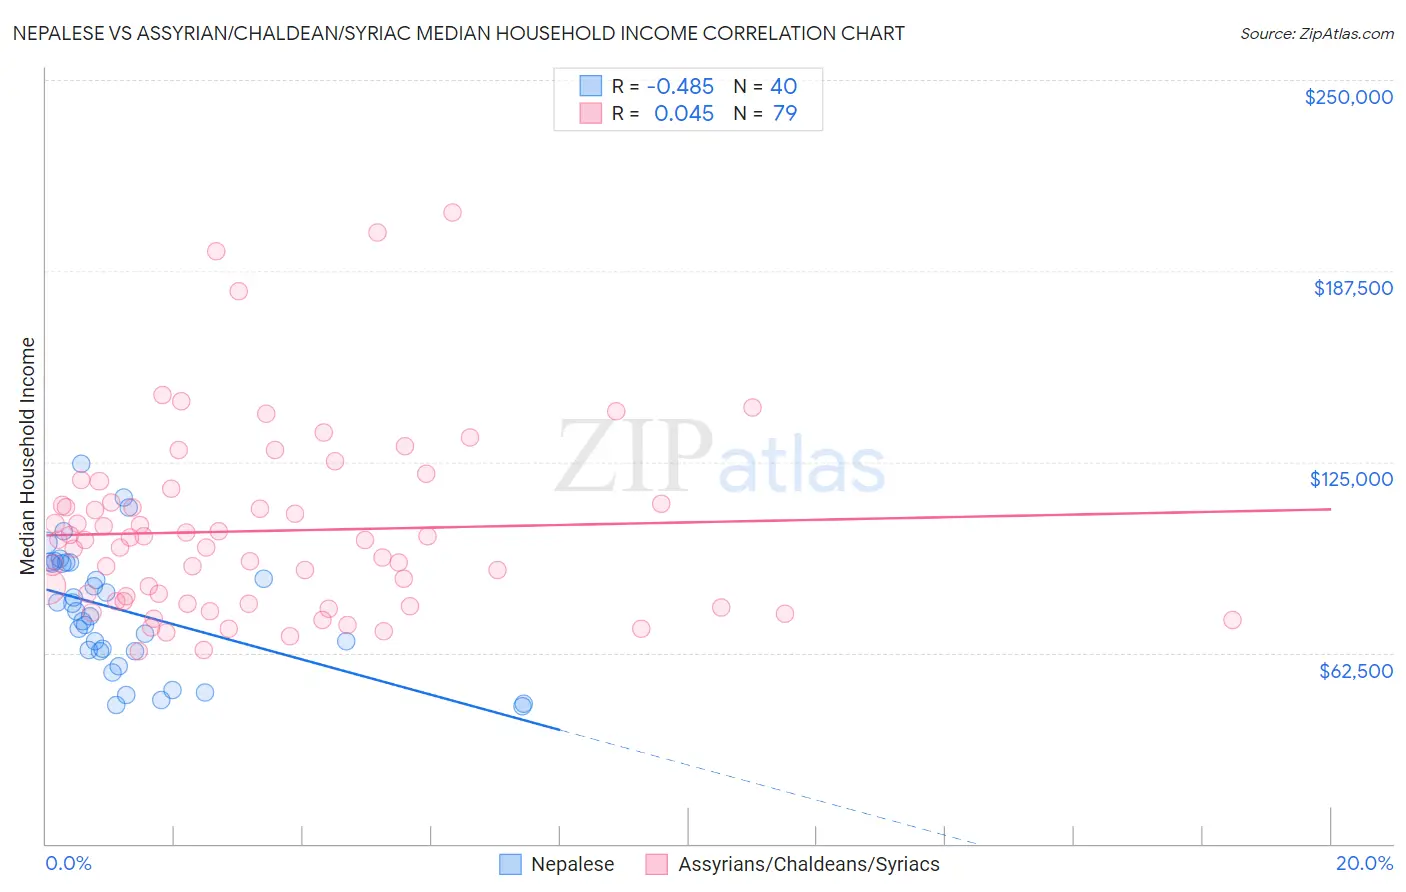
Nepalese vs Assyrian/Chaldean/Syriac Median Household Income Correlation Chart
The statistical analysis conducted on geographies consisting of 24,521,755 people shows a moderate negative correlation between the proportion of Nepalese and median household income in the United States with a correlation coefficient (R) of -0.485 and weighted average of $82,410. Similarly, the statistical analysis conducted on geographies consisting of 110,256,349 people shows no correlation between the proportion of Assyrians/Chaldeans/Syriacs and median household income in the United States with a correlation coefficient (R) of 0.045 and weighted average of $91,991, a difference of 11.6%.
Median Household Income Correlation Summary
| Measurement | Nepalese | Assyrian/Chaldean/Syriac |
| Minimum | $45,000 | $63,036 |
| Maximum | $124,273 | $206,750 |
| Range | $79,273 | $143,714 |
| Mean | $75,935 | $102,405 |
| Median | $75,316 | $99,390 |
| Interquartile 25% (IQ1) | $63,001 | $78,587 |
| Interquartile 75% (IQ3) | $91,848 | $111,848 |
| Interquartile Range (IQR) | $28,847 | $33,262 |
| Standard Deviation (Sample) | $20,077 | $30,418 |
| Standard Deviation (Population) | $19,825 | $30,225 |
Similar Demographics by Median Household Income
Demographics Similar to Nepalese by Median Household Income
In terms of median household income, the demographic groups most similar to Nepalese are Venezuelan ($82,432, a difference of 0.030%), Salvadoran ($82,449, a difference of 0.050%), Panamanian ($82,272, a difference of 0.17%), Immigrants from Uruguay ($82,560, a difference of 0.18%), and Vietnamese ($82,248, a difference of 0.20%).
| Demographics | Rating | Rank | Median Household Income |
| Immigrants | Kenya | 21.3 /100 | #206 | Fair $83,068 |
| Dutch | 20.3 /100 | #207 | Fair $82,971 |
| French Canadians | 18.7 /100 | #208 | Poor $82,810 |
| Immigrants | Iraq | 16.7 /100 | #209 | Poor $82,594 |
| Immigrants | Uruguay | 16.4 /100 | #210 | Poor $82,560 |
| Salvadorans | 15.4 /100 | #211 | Poor $82,449 |
| Venezuelans | 15.3 /100 | #212 | Poor $82,432 |
| Nepalese | 15.1 /100 | #213 | Poor $82,410 |
| Panamanians | 14.0 /100 | #214 | Poor $82,272 |
| Vietnamese | 13.8 /100 | #215 | Poor $82,248 |
| Yugoslavians | 13.3 /100 | #216 | Poor $82,186 |
| Ecuadorians | 12.5 /100 | #217 | Poor $82,070 |
| Whites/Caucasians | 12.2 /100 | #218 | Poor $82,029 |
| Nigerians | 10.3 /100 | #219 | Poor $81,725 |
| Immigrants | Venezuela | 9.0 /100 | #220 | Tragic $81,506 |
Demographics Similar to Assyrians/Chaldeans/Syriacs by Median Household Income
In terms of median household income, the demographic groups most similar to Assyrians/Chaldeans/Syriacs are Romanian ($91,994, a difference of 0.0%), Immigrants from Vietnam ($91,987, a difference of 0.0%), Immigrants from Canada ($92,029, a difference of 0.040%), Immigrants from Western Europe ($91,936, a difference of 0.060%), and Immigrants from Hungary ($92,094, a difference of 0.11%).
| Demographics | Rating | Rank | Median Household Income |
| Italians | 99.1 /100 | #83 | Exceptional $92,475 |
| Immigrants | Argentina | 99.1 /100 | #84 | Exceptional $92,417 |
| Immigrants | Croatia | 99.0 /100 | #85 | Exceptional $92,225 |
| Immigrants | England | 98.9 /100 | #86 | Exceptional $92,098 |
| Immigrants | Hungary | 98.9 /100 | #87 | Exceptional $92,094 |
| Immigrants | Canada | 98.8 /100 | #88 | Exceptional $92,029 |
| Romanians | 98.8 /100 | #89 | Exceptional $91,994 |
| Assyrians/Chaldeans/Syriacs | 98.8 /100 | #90 | Exceptional $91,991 |
| Immigrants | Vietnam | 98.8 /100 | #91 | Exceptional $91,987 |
| Immigrants | Western Europe | 98.8 /100 | #92 | Exceptional $91,936 |
| Immigrants | Lebanon | 98.7 /100 | #93 | Exceptional $91,887 |
| Immigrants | North America | 98.7 /100 | #94 | Exceptional $91,860 |
| Armenians | 98.7 /100 | #95 | Exceptional $91,807 |
| Jordanians | 98.7 /100 | #96 | Exceptional $91,794 |
| Immigrants | Serbia | 98.6 /100 | #97 | Exceptional $91,730 |