Native/Alaskan vs Turkish Per Capita Income
COMPARE
Native/Alaskan
Turkish
Per Capita Income
Per Capita Income Comparison
Natives/Alaskans
Turks
$33,279
PER CAPITA INCOME
0.0/ 100
METRIC RATING
334th/ 347
METRIC RANK
$52,391
PER CAPITA INCOME
100.0/ 100
METRIC RATING
31st/ 347
METRIC RANK
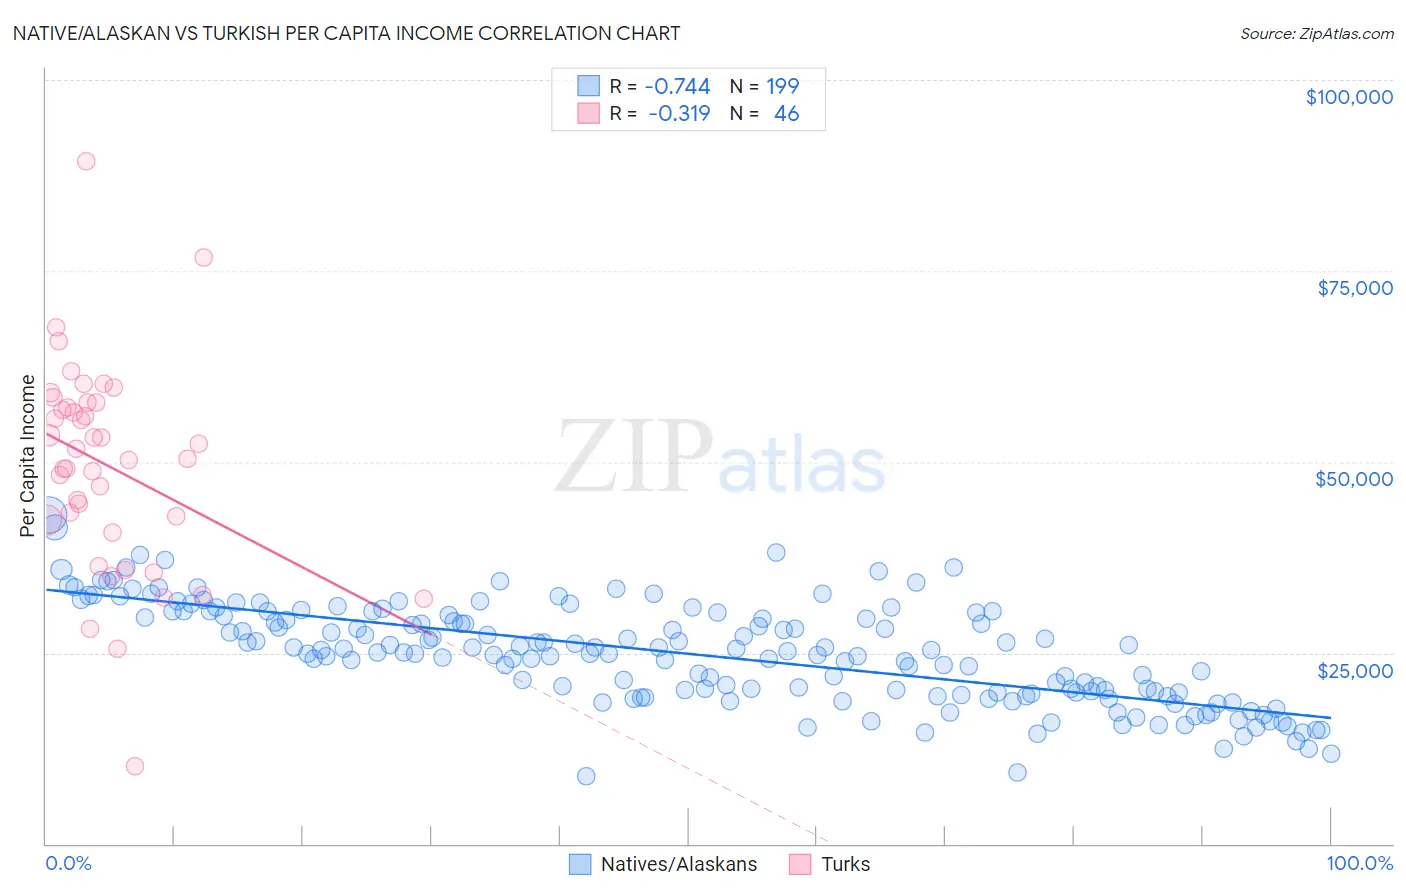
Native/Alaskan vs Turkish Per Capita Income Correlation Chart
The statistical analysis conducted on geographies consisting of 513,079,708 people shows a strong negative correlation between the proportion of Natives/Alaskans and per capita income in the United States with a correlation coefficient (R) of -0.744 and weighted average of $33,279. Similarly, the statistical analysis conducted on geographies consisting of 271,859,983 people shows a mild negative correlation between the proportion of Turks and per capita income in the United States with a correlation coefficient (R) of -0.319 and weighted average of $52,391, a difference of 57.4%.
Per Capita Income Correlation Summary
| Measurement | Native/Alaskan | Turkish |
| Minimum | $8,837 | $10,169 |
| Maximum | $43,037 | $89,333 |
| Range | $34,200 | $79,164 |
| Mean | $24,883 | $49,588 |
| Median | $25,158 | $51,043 |
| Interquartile 25% (IQ1) | $19,735 | $42,405 |
| Interquartile 75% (IQ3) | $30,217 | $57,708 |
| Interquartile Range (IQR) | $10,482 | $15,302 |
| Standard Deviation (Sample) | $6,547 | $13,772 |
| Standard Deviation (Population) | $6,531 | $13,621 |
Similar Demographics by Per Capita Income
Demographics Similar to Natives/Alaskans by Per Capita Income
In terms of per capita income, the demographic groups most similar to Natives/Alaskans are Yuman ($33,236, a difference of 0.13%), Yakama ($33,009, a difference of 0.82%), Houma ($32,996, a difference of 0.86%), Immigrants from Yemen ($33,696, a difference of 1.3%), and Sioux ($33,921, a difference of 1.9%).
| Demographics | Rating | Rank | Per Capita Income |
| Apache | 0.0 /100 | #327 | Tragic $34,886 |
| Menominee | 0.0 /100 | #328 | Tragic $34,578 |
| Mexicans | 0.0 /100 | #329 | Tragic $34,559 |
| Spanish American Indians | 0.0 /100 | #330 | Tragic $34,195 |
| Immigrants | Mexico | 0.0 /100 | #331 | Tragic $33,931 |
| Sioux | 0.0 /100 | #332 | Tragic $33,921 |
| Immigrants | Yemen | 0.0 /100 | #333 | Tragic $33,696 |
| Natives/Alaskans | 0.0 /100 | #334 | Tragic $33,279 |
| Yuman | 0.0 /100 | #335 | Tragic $33,236 |
| Yakama | 0.0 /100 | #336 | Tragic $33,009 |
| Houma | 0.0 /100 | #337 | Tragic $32,996 |
| Arapaho | 0.0 /100 | #338 | Tragic $32,345 |
| Pueblo | 0.0 /100 | #339 | Tragic $32,012 |
| Crow | 0.0 /100 | #340 | Tragic $31,729 |
| Puerto Ricans | 0.0 /100 | #341 | Tragic $31,268 |
Demographics Similar to Turks by Per Capita Income
In terms of per capita income, the demographic groups most similar to Turks are Immigrants from Austria ($52,503, a difference of 0.21%), Immigrants from Norway ($52,217, a difference of 0.33%), Israeli ($52,596, a difference of 0.39%), Latvian ($52,649, a difference of 0.49%), and Immigrants from South Central Asia ($52,660, a difference of 0.51%).
| Demographics | Rating | Rank | Per Capita Income |
| Immigrants | Denmark | 100.0 /100 | #24 | Exceptional $53,799 |
| Immigrants | Japan | 100.0 /100 | #25 | Exceptional $53,359 |
| Russians | 100.0 /100 | #26 | Exceptional $53,154 |
| Immigrants | South Central Asia | 100.0 /100 | #27 | Exceptional $52,660 |
| Latvians | 100.0 /100 | #28 | Exceptional $52,649 |
| Israelis | 100.0 /100 | #29 | Exceptional $52,596 |
| Immigrants | Austria | 100.0 /100 | #30 | Exceptional $52,503 |
| Turks | 100.0 /100 | #31 | Exceptional $52,391 |
| Immigrants | Norway | 100.0 /100 | #32 | Exceptional $52,217 |
| Australians | 100.0 /100 | #33 | Exceptional $52,074 |
| Immigrants | Russia | 100.0 /100 | #34 | Exceptional $52,044 |
| Burmese | 100.0 /100 | #35 | Exceptional $52,005 |
| Immigrants | Greece | 100.0 /100 | #36 | Exceptional $51,891 |
| Estonians | 100.0 /100 | #37 | Exceptional $51,875 |
| Immigrants | Czechoslovakia | 100.0 /100 | #38 | Exceptional $51,770 |