Immigrants from Sri Lanka vs Turkish Per Capita Income
COMPARE
Immigrants from Sri Lanka
Turkish
Per Capita Income
Per Capita Income Comparison
Immigrants from Sri Lanka
Turks
$50,555
PER CAPITA INCOME
100.0/ 100
METRIC RATING
50th/ 347
METRIC RANK
$52,391
PER CAPITA INCOME
100.0/ 100
METRIC RATING
31st/ 347
METRIC RANK
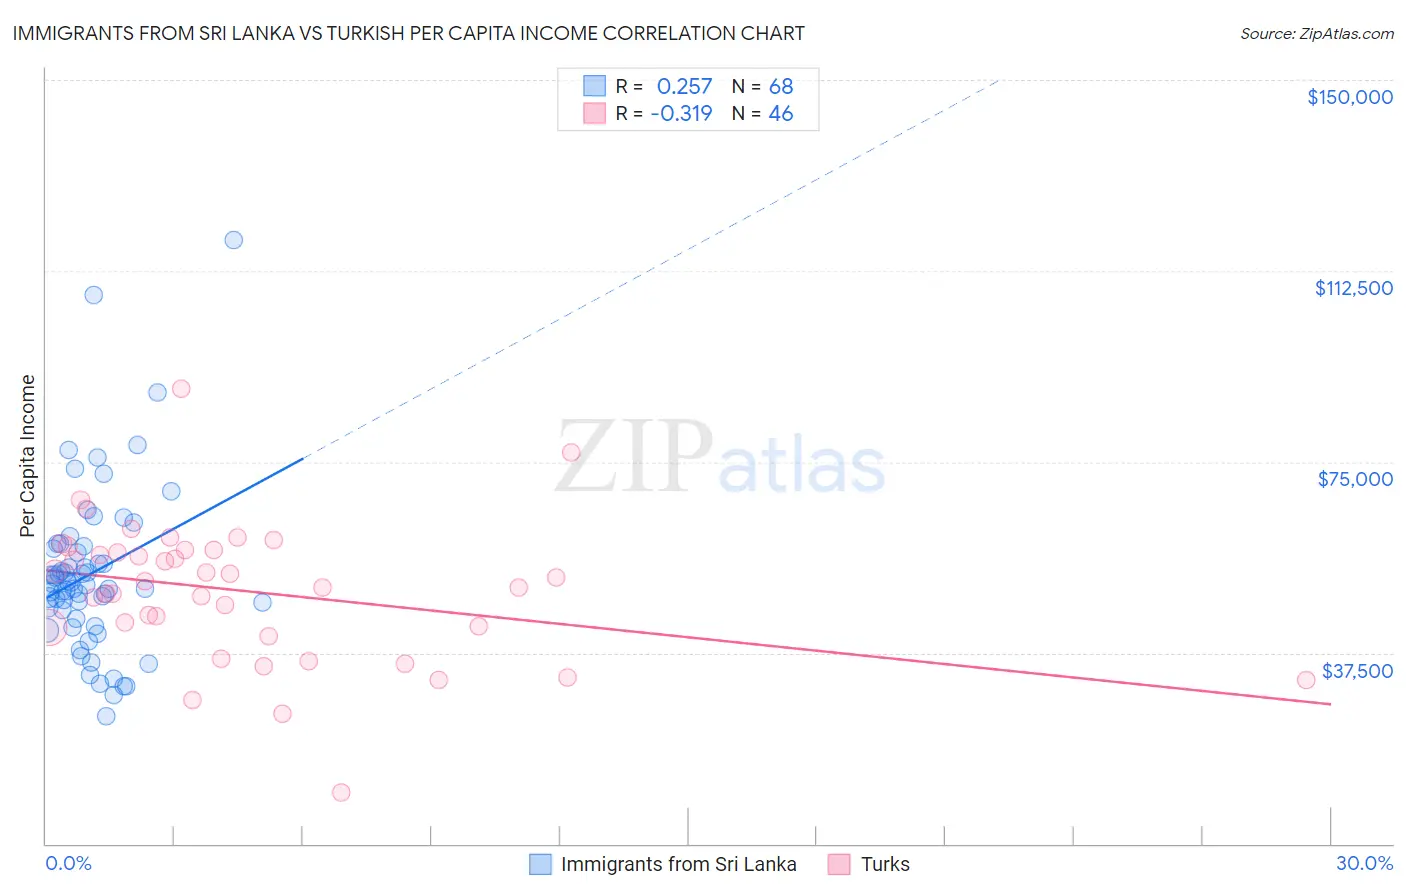
Immigrants from Sri Lanka vs Turkish Per Capita Income Correlation Chart
The statistical analysis conducted on geographies consisting of 149,699,244 people shows a weak positive correlation between the proportion of Immigrants from Sri Lanka and per capita income in the United States with a correlation coefficient (R) of 0.257 and weighted average of $50,555. Similarly, the statistical analysis conducted on geographies consisting of 271,859,983 people shows a mild negative correlation between the proportion of Turks and per capita income in the United States with a correlation coefficient (R) of -0.319 and weighted average of $52,391, a difference of 3.6%.
Per Capita Income Correlation Summary
| Measurement | Immigrants from Sri Lanka | Turkish |
| Minimum | $24,946 | $10,169 |
| Maximum | $118,591 | $89,333 |
| Range | $93,645 | $79,164 |
| Mean | $53,052 | $49,588 |
| Median | $50,889 | $51,043 |
| Interquartile 25% (IQ1) | $45,023 | $42,405 |
| Interquartile 75% (IQ3) | $58,187 | $57,708 |
| Interquartile Range (IQR) | $13,164 | $15,302 |
| Standard Deviation (Sample) | $16,356 | $13,772 |
| Standard Deviation (Population) | $16,236 | $13,621 |
Demographics Similar to Immigrants from Sri Lanka and Turks by Per Capita Income
In terms of per capita income, the demographic groups most similar to Immigrants from Sri Lanka are New Zealander ($50,575, a difference of 0.040%), Immigrants from Serbia ($50,810, a difference of 0.50%), Bulgarian ($50,906, a difference of 0.69%), Immigrants from Latvia ($50,914, a difference of 0.71%), and Immigrants from Spain ($50,933, a difference of 0.75%). Similarly, the demographic groups most similar to Turks are Immigrants from Austria ($52,503, a difference of 0.21%), Immigrants from Norway ($52,217, a difference of 0.33%), Australian ($52,074, a difference of 0.61%), Immigrants from Russia ($52,044, a difference of 0.67%), and Burmese ($52,005, a difference of 0.74%).
| Demographics | Rating | Rank | Per Capita Income |
| Immigrants | Austria | 100.0 /100 | #30 | Exceptional $52,503 |
| Turks | 100.0 /100 | #31 | Exceptional $52,391 |
| Immigrants | Norway | 100.0 /100 | #32 | Exceptional $52,217 |
| Australians | 100.0 /100 | #33 | Exceptional $52,074 |
| Immigrants | Russia | 100.0 /100 | #34 | Exceptional $52,044 |
| Burmese | 100.0 /100 | #35 | Exceptional $52,005 |
| Immigrants | Greece | 100.0 /100 | #36 | Exceptional $51,891 |
| Estonians | 100.0 /100 | #37 | Exceptional $51,875 |
| Immigrants | Czechoslovakia | 100.0 /100 | #38 | Exceptional $51,770 |
| Cambodians | 100.0 /100 | #39 | Exceptional $51,731 |
| Immigrants | Korea | 100.0 /100 | #40 | Exceptional $51,671 |
| Immigrants | South Africa | 100.0 /100 | #41 | Exceptional $51,465 |
| Immigrants | Turkey | 100.0 /100 | #42 | Exceptional $51,368 |
| Immigrants | Lithuania | 100.0 /100 | #43 | Exceptional $51,361 |
| Immigrants | Europe | 100.0 /100 | #44 | Exceptional $50,950 |
| Immigrants | Spain | 100.0 /100 | #45 | Exceptional $50,933 |
| Immigrants | Latvia | 100.0 /100 | #46 | Exceptional $50,914 |
| Bulgarians | 100.0 /100 | #47 | Exceptional $50,906 |
| Immigrants | Serbia | 100.0 /100 | #48 | Exceptional $50,810 |
| New Zealanders | 100.0 /100 | #49 | Exceptional $50,575 |
| Immigrants | Sri Lanka | 100.0 /100 | #50 | Exceptional $50,555 |