Native/Alaskan vs Immigrants from Venezuela Per Capita Income
COMPARE
Native/Alaskan
Immigrants from Venezuela
Per Capita Income
Per Capita Income Comparison
Natives/Alaskans
Immigrants from Venezuela
$33,279
PER CAPITA INCOME
0.0/ 100
METRIC RATING
334th/ 347
METRIC RANK
$41,727
PER CAPITA INCOME
10.2/ 100
METRIC RATING
213th/ 347
METRIC RANK
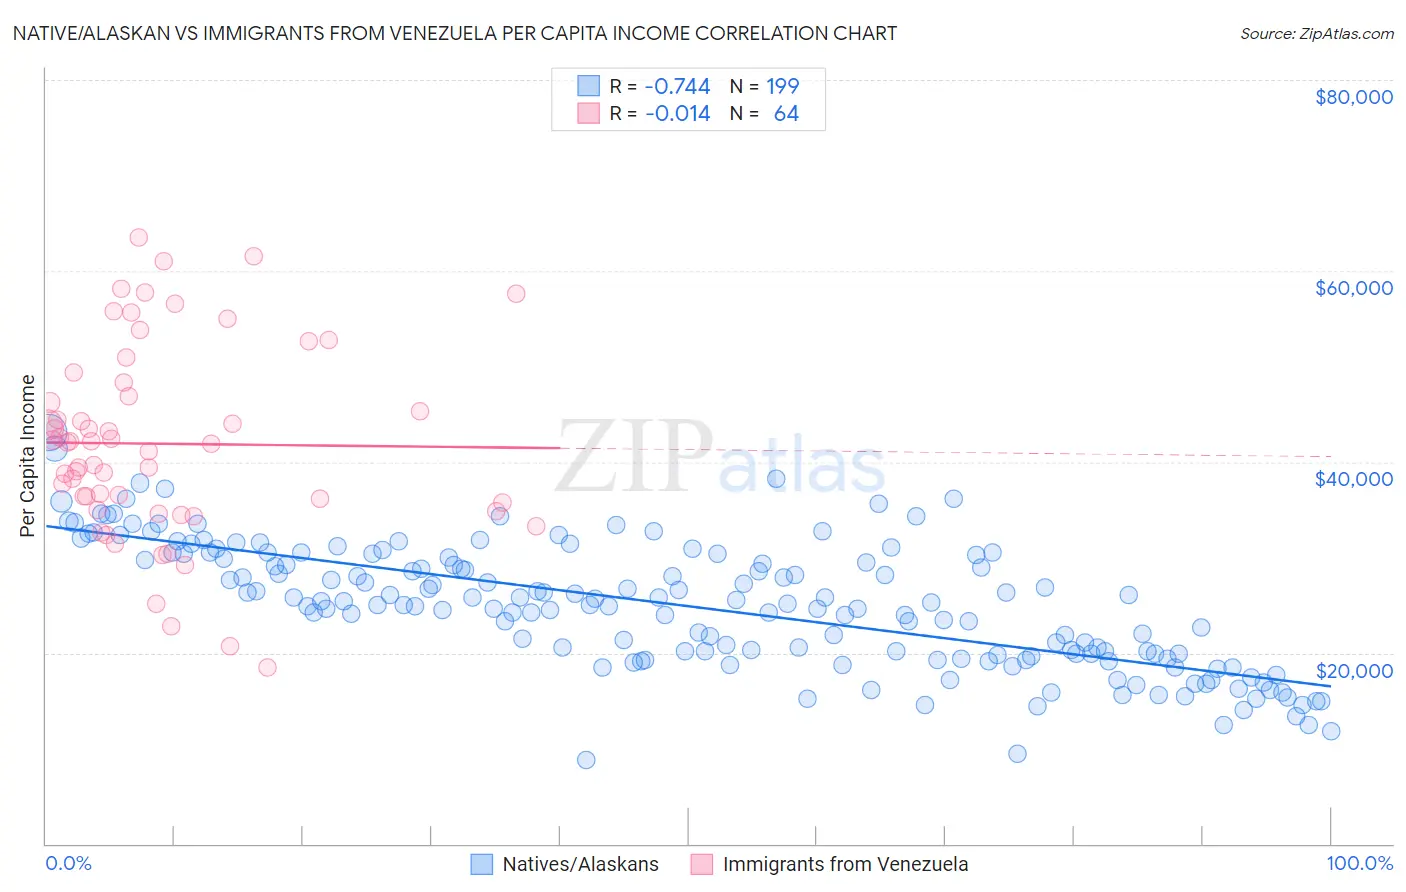
Native/Alaskan vs Immigrants from Venezuela Per Capita Income Correlation Chart
The statistical analysis conducted on geographies consisting of 513,079,708 people shows a strong negative correlation between the proportion of Natives/Alaskans and per capita income in the United States with a correlation coefficient (R) of -0.744 and weighted average of $33,279. Similarly, the statistical analysis conducted on geographies consisting of 287,848,526 people shows no correlation between the proportion of Immigrants from Venezuela and per capita income in the United States with a correlation coefficient (R) of -0.014 and weighted average of $41,727, a difference of 25.4%.
Per Capita Income Correlation Summary
| Measurement | Native/Alaskan | Immigrants from Venezuela |
| Minimum | $8,837 | $18,497 |
| Maximum | $43,037 | $63,503 |
| Range | $34,200 | $45,006 |
| Mean | $24,883 | $41,894 |
| Median | $25,158 | $41,937 |
| Interquartile 25% (IQ1) | $19,735 | $35,384 |
| Interquartile 75% (IQ3) | $30,217 | $47,592 |
| Interquartile Range (IQR) | $10,482 | $12,208 |
| Standard Deviation (Sample) | $6,547 | $10,042 |
| Standard Deviation (Population) | $6,531 | $9,963 |
Similar Demographics by Per Capita Income
Demographics Similar to Natives/Alaskans by Per Capita Income
In terms of per capita income, the demographic groups most similar to Natives/Alaskans are Yuman ($33,236, a difference of 0.13%), Yakama ($33,009, a difference of 0.82%), Houma ($32,996, a difference of 0.86%), Immigrants from Yemen ($33,696, a difference of 1.3%), and Sioux ($33,921, a difference of 1.9%).
| Demographics | Rating | Rank | Per Capita Income |
| Apache | 0.0 /100 | #327 | Tragic $34,886 |
| Menominee | 0.0 /100 | #328 | Tragic $34,578 |
| Mexicans | 0.0 /100 | #329 | Tragic $34,559 |
| Spanish American Indians | 0.0 /100 | #330 | Tragic $34,195 |
| Immigrants | Mexico | 0.0 /100 | #331 | Tragic $33,931 |
| Sioux | 0.0 /100 | #332 | Tragic $33,921 |
| Immigrants | Yemen | 0.0 /100 | #333 | Tragic $33,696 |
| Natives/Alaskans | 0.0 /100 | #334 | Tragic $33,279 |
| Yuman | 0.0 /100 | #335 | Tragic $33,236 |
| Yakama | 0.0 /100 | #336 | Tragic $33,009 |
| Houma | 0.0 /100 | #337 | Tragic $32,996 |
| Arapaho | 0.0 /100 | #338 | Tragic $32,345 |
| Pueblo | 0.0 /100 | #339 | Tragic $32,012 |
| Crow | 0.0 /100 | #340 | Tragic $31,729 |
| Puerto Ricans | 0.0 /100 | #341 | Tragic $31,268 |
Demographics Similar to Immigrants from Venezuela by Per Capita Income
In terms of per capita income, the demographic groups most similar to Immigrants from Venezuela are Immigrants from Bangladesh ($41,709, a difference of 0.040%), Sudanese ($41,695, a difference of 0.080%), Tongan ($41,693, a difference of 0.080%), Guamanian/Chamorro ($41,678, a difference of 0.12%), and Trinidadian and Tobagonian ($41,655, a difference of 0.17%).
| Demographics | Rating | Rank | Per Capita Income |
| Ghanaians | 15.7 /100 | #206 | Poor $42,164 |
| Venezuelans | 14.4 /100 | #207 | Poor $42,074 |
| Panamanians | 13.9 /100 | #208 | Poor $42,035 |
| Immigrants | Sudan | 13.2 /100 | #209 | Poor $41,986 |
| Ecuadorians | 12.9 /100 | #210 | Poor $41,958 |
| Immigrants | Panama | 11.6 /100 | #211 | Poor $41,853 |
| Immigrants | Senegal | 11.3 /100 | #212 | Poor $41,830 |
| Immigrants | Venezuela | 10.2 /100 | #213 | Poor $41,727 |
| Immigrants | Bangladesh | 10.1 /100 | #214 | Poor $41,709 |
| Sudanese | 9.9 /100 | #215 | Tragic $41,695 |
| Tongans | 9.9 /100 | #216 | Tragic $41,693 |
| Guamanians/Chamorros | 9.7 /100 | #217 | Tragic $41,678 |
| Trinidadians and Tobagonians | 9.5 /100 | #218 | Tragic $41,655 |
| Puget Sound Salish | 8.1 /100 | #219 | Tragic $41,495 |
| Immigrants | Barbados | 7.9 /100 | #220 | Tragic $41,478 |