Native/Alaskan vs Chippewa Per Capita Income
COMPARE
Native/Alaskan
Chippewa
Per Capita Income
Per Capita Income Comparison
Natives/Alaskans
Chippewa
$33,279
PER CAPITA INCOME
0.0/ 100
METRIC RATING
334th/ 347
METRIC RANK
$36,631
PER CAPITA INCOME
0.0/ 100
METRIC RATING
311th/ 347
METRIC RANK
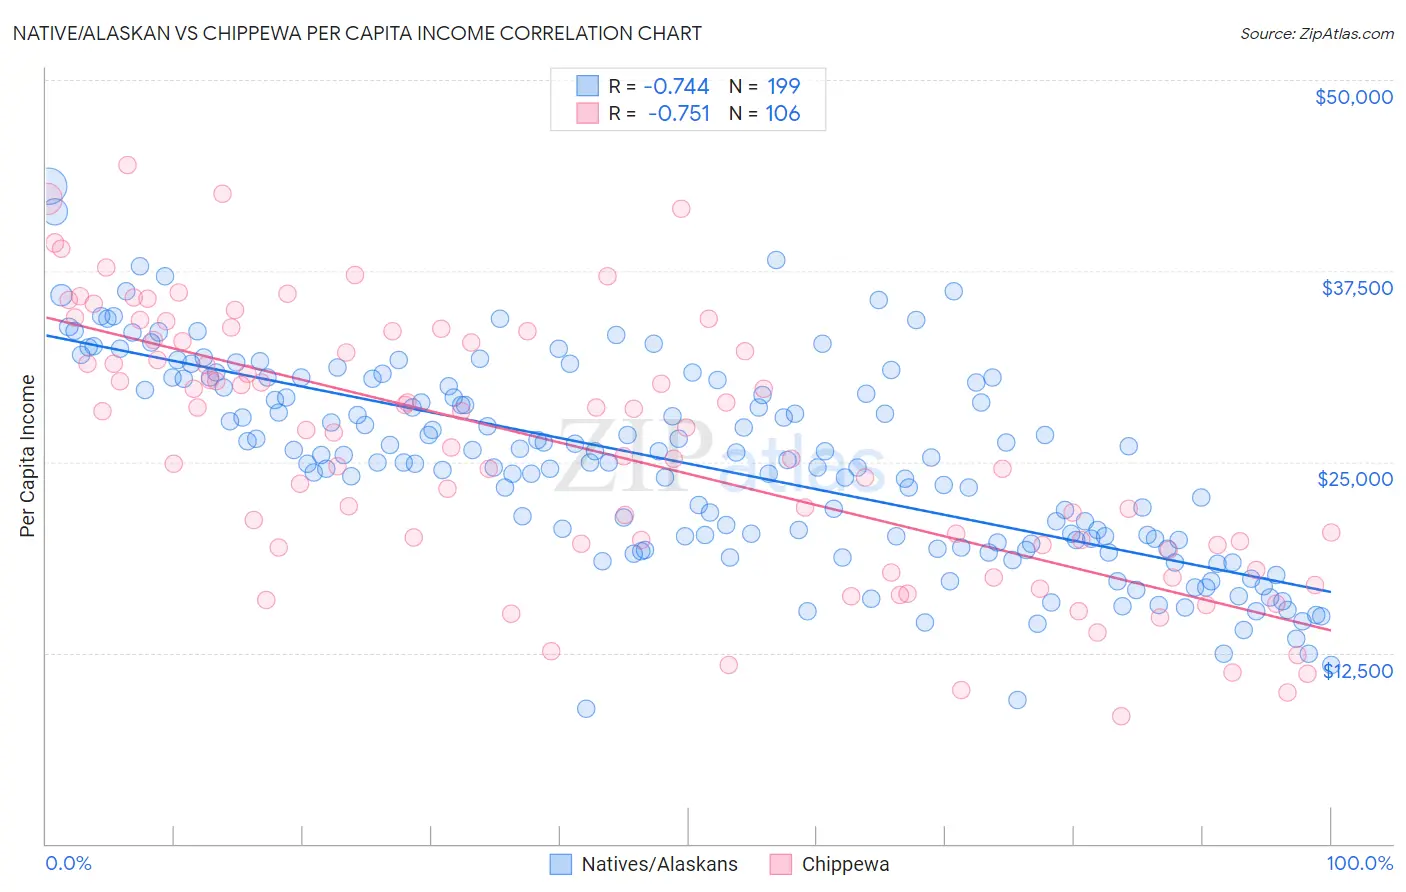
Native/Alaskan vs Chippewa Per Capita Income Correlation Chart
The statistical analysis conducted on geographies consisting of 513,079,708 people shows a strong negative correlation between the proportion of Natives/Alaskans and per capita income in the United States with a correlation coefficient (R) of -0.744 and weighted average of $33,279. Similarly, the statistical analysis conducted on geographies consisting of 215,067,961 people shows a strong negative correlation between the proportion of Chippewa and per capita income in the United States with a correlation coefficient (R) of -0.751 and weighted average of $36,631, a difference of 10.1%.
Per Capita Income Correlation Summary
| Measurement | Native/Alaskan | Chippewa |
| Minimum | $8,837 | $8,325 |
| Maximum | $43,037 | $44,407 |
| Range | $34,200 | $36,082 |
| Mean | $24,883 | $25,989 |
| Median | $25,158 | $27,024 |
| Interquartile 25% (IQ1) | $19,735 | $19,564 |
| Interquartile 75% (IQ3) | $30,217 | $32,911 |
| Interquartile Range (IQR) | $10,482 | $13,347 |
| Standard Deviation (Sample) | $6,547 | $8,516 |
| Standard Deviation (Population) | $6,531 | $8,476 |
Similar Demographics by Per Capita Income
Demographics Similar to Natives/Alaskans by Per Capita Income
In terms of per capita income, the demographic groups most similar to Natives/Alaskans are Yuman ($33,236, a difference of 0.13%), Yakama ($33,009, a difference of 0.82%), Houma ($32,996, a difference of 0.86%), Immigrants from Yemen ($33,696, a difference of 1.3%), and Sioux ($33,921, a difference of 1.9%).
| Demographics | Rating | Rank | Per Capita Income |
| Apache | 0.0 /100 | #327 | Tragic $34,886 |
| Menominee | 0.0 /100 | #328 | Tragic $34,578 |
| Mexicans | 0.0 /100 | #329 | Tragic $34,559 |
| Spanish American Indians | 0.0 /100 | #330 | Tragic $34,195 |
| Immigrants | Mexico | 0.0 /100 | #331 | Tragic $33,931 |
| Sioux | 0.0 /100 | #332 | Tragic $33,921 |
| Immigrants | Yemen | 0.0 /100 | #333 | Tragic $33,696 |
| Natives/Alaskans | 0.0 /100 | #334 | Tragic $33,279 |
| Yuman | 0.0 /100 | #335 | Tragic $33,236 |
| Yakama | 0.0 /100 | #336 | Tragic $33,009 |
| Houma | 0.0 /100 | #337 | Tragic $32,996 |
| Arapaho | 0.0 /100 | #338 | Tragic $32,345 |
| Pueblo | 0.0 /100 | #339 | Tragic $32,012 |
| Crow | 0.0 /100 | #340 | Tragic $31,729 |
| Puerto Ricans | 0.0 /100 | #341 | Tragic $31,268 |
Demographics Similar to Chippewa by Per Capita Income
In terms of per capita income, the demographic groups most similar to Chippewa are Ute ($36,651, a difference of 0.060%), Immigrants from Honduras ($36,665, a difference of 0.090%), Fijian ($36,690, a difference of 0.16%), Chickasaw ($36,475, a difference of 0.43%), and Immigrants from Latin America ($36,823, a difference of 0.53%).
| Demographics | Rating | Rank | Per Capita Income |
| Hondurans | 0.1 /100 | #304 | Tragic $37,031 |
| Inupiat | 0.1 /100 | #305 | Tragic $36,999 |
| Immigrants | Haiti | 0.0 /100 | #306 | Tragic $36,849 |
| Immigrants | Latin America | 0.0 /100 | #307 | Tragic $36,823 |
| Fijians | 0.0 /100 | #308 | Tragic $36,690 |
| Immigrants | Honduras | 0.0 /100 | #309 | Tragic $36,665 |
| Ute | 0.0 /100 | #310 | Tragic $36,651 |
| Chippewa | 0.0 /100 | #311 | Tragic $36,631 |
| Chickasaw | 0.0 /100 | #312 | Tragic $36,475 |
| Bahamians | 0.0 /100 | #313 | Tragic $36,427 |
| Seminole | 0.0 /100 | #314 | Tragic $36,180 |
| Yaqui | 0.0 /100 | #315 | Tragic $36,112 |
| Choctaw | 0.0 /100 | #316 | Tragic $35,999 |
| Dutch West Indians | 0.0 /100 | #317 | Tragic $35,922 |
| Bangladeshis | 0.0 /100 | #318 | Tragic $35,897 |