Native/Alaskan vs Immigrants from Asia Median Male Earnings
COMPARE
Native/Alaskan
Immigrants from Asia
Median Male Earnings
Median Male Earnings Comparison
Natives/Alaskans
Immigrants from Asia
$44,775
MEDIAN MALE EARNINGS
0.0/ 100
METRIC RATING
331st/ 347
METRIC RANK
$63,240
MEDIAN MALE EARNINGS
100.0/ 100
METRIC RATING
35th/ 347
METRIC RANK
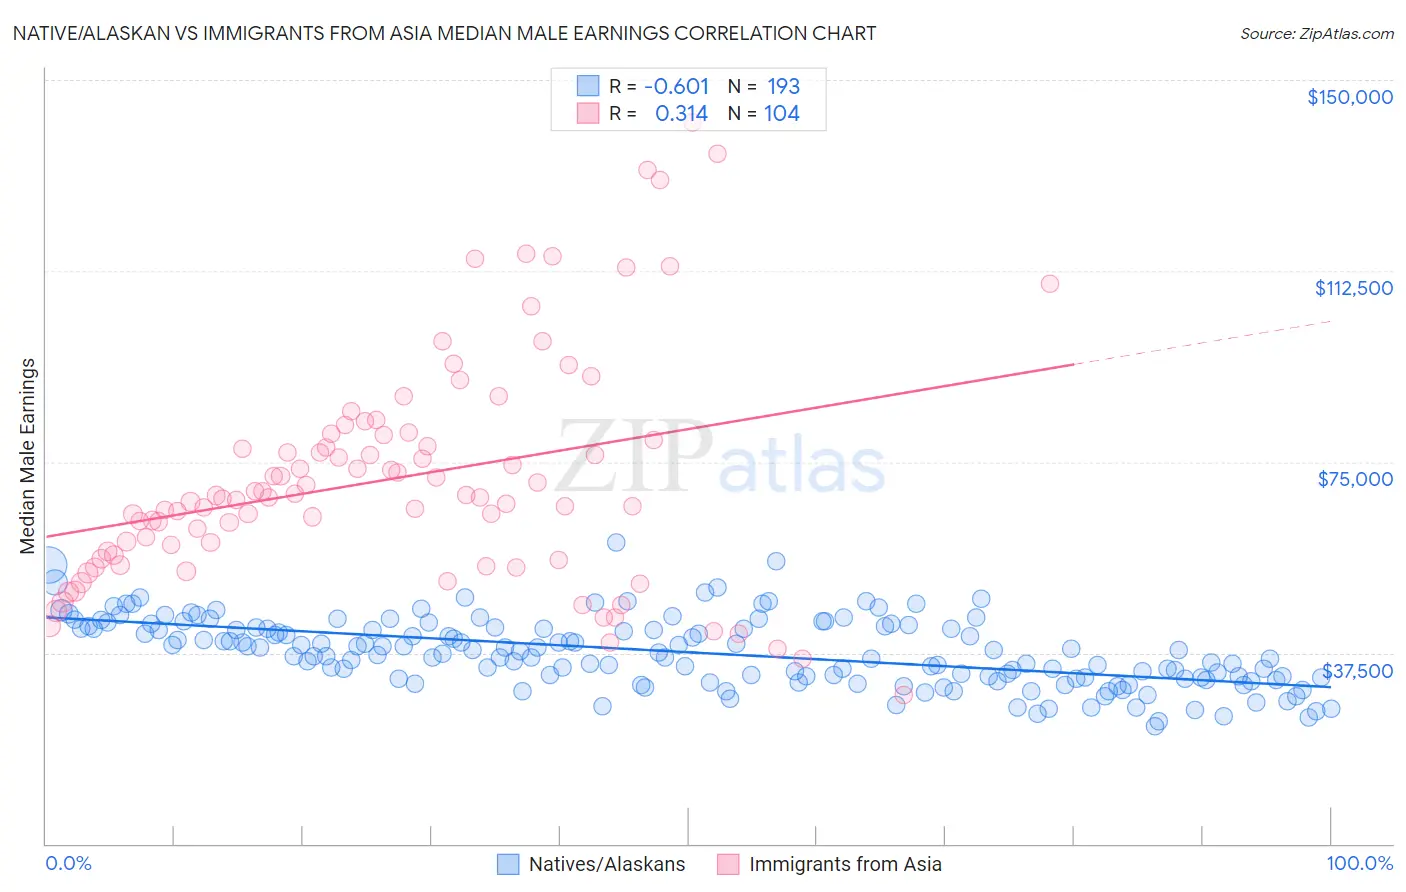
Native/Alaskan vs Immigrants from Asia Median Male Earnings Correlation Chart
The statistical analysis conducted on geographies consisting of 512,408,867 people shows a significant negative correlation between the proportion of Natives/Alaskans and median male earnings in the United States with a correlation coefficient (R) of -0.601 and weighted average of $44,775. Similarly, the statistical analysis conducted on geographies consisting of 548,524,419 people shows a mild positive correlation between the proportion of Immigrants from Asia and median male earnings in the United States with a correlation coefficient (R) of 0.314 and weighted average of $63,240, a difference of 41.2%.
Median Male Earnings Correlation Summary
| Measurement | Native/Alaskan | Immigrants from Asia |
| Minimum | $23,050 | $29,236 |
| Maximum | $59,216 | $141,758 |
| Range | $36,166 | $112,522 |
| Mean | $37,642 | $71,617 |
| Median | $37,848 | $67,918 |
| Interquartile 25% (IQ1) | $32,642 | $56,355 |
| Interquartile 75% (IQ3) | $42,387 | $79,747 |
| Interquartile Range (IQR) | $9,745 | $23,393 |
| Standard Deviation (Sample) | $6,692 | $22,311 |
| Standard Deviation (Population) | $6,675 | $22,203 |
Similar Demographics by Median Male Earnings
Demographics Similar to Natives/Alaskans by Median Male Earnings
In terms of median male earnings, the demographic groups most similar to Natives/Alaskans are Bahamian ($44,756, a difference of 0.040%), Immigrants from Mexico ($44,960, a difference of 0.41%), Yakama ($45,002, a difference of 0.51%), Kiowa ($45,094, a difference of 0.71%), and Immigrants from Bahamas ($45,176, a difference of 0.90%).
| Demographics | Rating | Rank | Median Male Earnings |
| Blacks/African Americans | 0.0 /100 | #324 | Tragic $45,523 |
| Yuman | 0.0 /100 | #325 | Tragic $45,446 |
| Immigrants | Haiti | 0.0 /100 | #326 | Tragic $45,266 |
| Immigrants | Bahamas | 0.0 /100 | #327 | Tragic $45,176 |
| Kiowa | 0.0 /100 | #328 | Tragic $45,094 |
| Yakama | 0.0 /100 | #329 | Tragic $45,002 |
| Immigrants | Mexico | 0.0 /100 | #330 | Tragic $44,960 |
| Natives/Alaskans | 0.0 /100 | #331 | Tragic $44,775 |
| Bahamians | 0.0 /100 | #332 | Tragic $44,756 |
| Immigrants | Congo | 0.0 /100 | #333 | Tragic $44,204 |
| Immigrants | Yemen | 0.0 /100 | #334 | Tragic $44,083 |
| Spanish American Indians | 0.0 /100 | #335 | Tragic $44,010 |
| Immigrants | Cuba | 0.0 /100 | #336 | Tragic $43,461 |
| Menominee | 0.0 /100 | #337 | Tragic $42,581 |
| Crow | 0.0 /100 | #338 | Tragic $42,434 |
Demographics Similar to Immigrants from Asia by Median Male Earnings
In terms of median male earnings, the demographic groups most similar to Immigrants from Asia are Israeli ($63,228, a difference of 0.020%), Immigrants from Russia ($63,326, a difference of 0.14%), Immigrants from Lithuania ($63,346, a difference of 0.17%), Soviet Union ($63,382, a difference of 0.22%), and Immigrants from Sri Lanka ($63,099, a difference of 0.22%).
| Demographics | Rating | Rank | Median Male Earnings |
| Russians | 100.0 /100 | #28 | Exceptional $63,939 |
| Asians | 100.0 /100 | #29 | Exceptional $63,827 |
| Immigrants | France | 100.0 /100 | #30 | Exceptional $63,715 |
| Latvians | 100.0 /100 | #31 | Exceptional $63,498 |
| Soviet Union | 100.0 /100 | #32 | Exceptional $63,382 |
| Immigrants | Lithuania | 100.0 /100 | #33 | Exceptional $63,346 |
| Immigrants | Russia | 100.0 /100 | #34 | Exceptional $63,326 |
| Immigrants | Asia | 100.0 /100 | #35 | Exceptional $63,240 |
| Israelis | 100.0 /100 | #36 | Exceptional $63,228 |
| Immigrants | Sri Lanka | 100.0 /100 | #37 | Exceptional $63,099 |
| Maltese | 100.0 /100 | #38 | Exceptional $62,953 |
| Immigrants | South Africa | 100.0 /100 | #39 | Exceptional $62,899 |
| Australians | 100.0 /100 | #40 | Exceptional $62,857 |
| Immigrants | Turkey | 100.0 /100 | #41 | Exceptional $62,728 |
| Immigrants | Greece | 100.0 /100 | #42 | Exceptional $62,689 |