Immigrants from China vs Immigrants from Asia Median Male Earnings
COMPARE
Immigrants from China
Immigrants from Asia
Median Male Earnings
Median Male Earnings Comparison
Immigrants from China
Immigrants from Asia
$67,353
MEDIAN MALE EARNINGS
100.0/ 100
METRIC RATING
13th/ 347
METRIC RANK
$63,240
MEDIAN MALE EARNINGS
100.0/ 100
METRIC RATING
35th/ 347
METRIC RANK
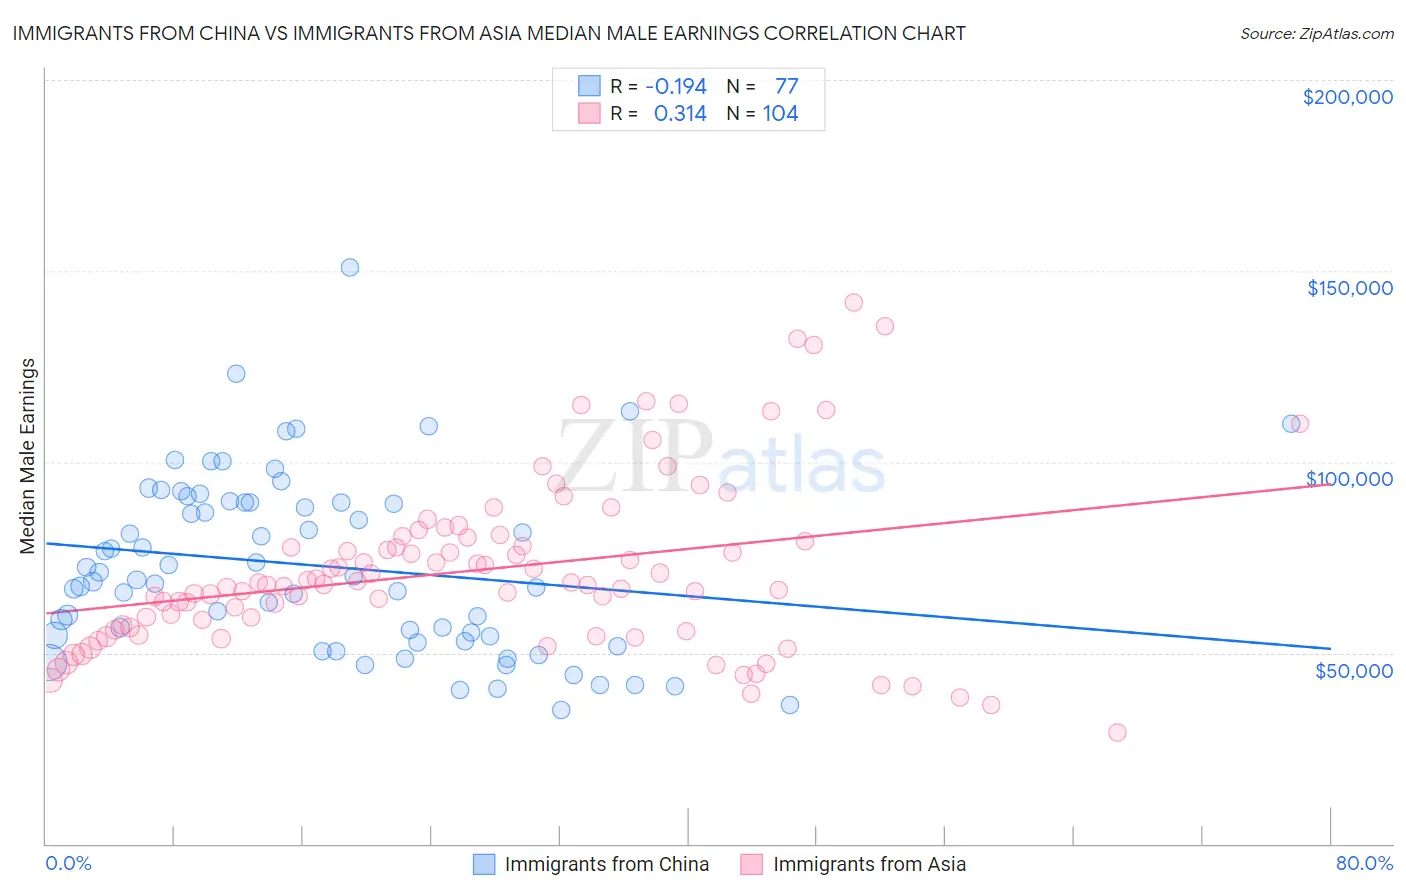
Immigrants from China vs Immigrants from Asia Median Male Earnings Correlation Chart
The statistical analysis conducted on geographies consisting of 456,906,248 people shows a poor negative correlation between the proportion of Immigrants from China and median male earnings in the United States with a correlation coefficient (R) of -0.194 and weighted average of $67,353. Similarly, the statistical analysis conducted on geographies consisting of 548,524,419 people shows a mild positive correlation between the proportion of Immigrants from Asia and median male earnings in the United States with a correlation coefficient (R) of 0.314 and weighted average of $63,240, a difference of 6.5%.
Median Male Earnings Correlation Summary
| Measurement | Immigrants from China | Immigrants from Asia |
| Minimum | $35,000 | $29,236 |
| Maximum | $150,740 | $141,758 |
| Range | $115,740 | $112,522 |
| Mean | $72,671 | $71,617 |
| Median | $69,216 | $67,918 |
| Interquartile 25% (IQ1) | $53,825 | $56,355 |
| Interquartile 75% (IQ3) | $89,334 | $79,747 |
| Interquartile Range (IQR) | $35,509 | $23,393 |
| Standard Deviation (Sample) | $23,135 | $22,311 |
| Standard Deviation (Population) | $22,985 | $22,203 |
Similar Demographics by Median Male Earnings
Demographics Similar to Immigrants from China by Median Male Earnings
In terms of median male earnings, the demographic groups most similar to Immigrants from China are Okinawan ($67,232, a difference of 0.18%), Immigrants from Australia ($67,634, a difference of 0.42%), Immigrants from Ireland ($67,698, a difference of 0.51%), Immigrants from Eastern Asia ($66,903, a difference of 0.67%), and Eastern European ($66,472, a difference of 1.3%).
| Demographics | Rating | Rank | Median Male Earnings |
| Iranians | 100.0 /100 | #6 | Exceptional $70,648 |
| Immigrants | Hong Kong | 100.0 /100 | #7 | Exceptional $70,146 |
| Immigrants | Iran | 100.0 /100 | #8 | Exceptional $69,284 |
| Immigrants | South Central Asia | 100.0 /100 | #9 | Exceptional $68,960 |
| Immigrants | Israel | 100.0 /100 | #10 | Exceptional $68,716 |
| Immigrants | Ireland | 100.0 /100 | #11 | Exceptional $67,698 |
| Immigrants | Australia | 100.0 /100 | #12 | Exceptional $67,634 |
| Immigrants | China | 100.0 /100 | #13 | Exceptional $67,353 |
| Okinawans | 100.0 /100 | #14 | Exceptional $67,232 |
| Immigrants | Eastern Asia | 100.0 /100 | #15 | Exceptional $66,903 |
| Eastern Europeans | 100.0 /100 | #16 | Exceptional $66,472 |
| Immigrants | Belgium | 100.0 /100 | #17 | Exceptional $66,125 |
| Indians (Asian) | 100.0 /100 | #18 | Exceptional $66,078 |
| Cypriots | 100.0 /100 | #19 | Exceptional $65,549 |
| Immigrants | Japan | 100.0 /100 | #20 | Exceptional $65,518 |
Demographics Similar to Immigrants from Asia by Median Male Earnings
In terms of median male earnings, the demographic groups most similar to Immigrants from Asia are Israeli ($63,228, a difference of 0.020%), Immigrants from Russia ($63,326, a difference of 0.14%), Immigrants from Lithuania ($63,346, a difference of 0.17%), Soviet Union ($63,382, a difference of 0.22%), and Immigrants from Sri Lanka ($63,099, a difference of 0.22%).
| Demographics | Rating | Rank | Median Male Earnings |
| Russians | 100.0 /100 | #28 | Exceptional $63,939 |
| Asians | 100.0 /100 | #29 | Exceptional $63,827 |
| Immigrants | France | 100.0 /100 | #30 | Exceptional $63,715 |
| Latvians | 100.0 /100 | #31 | Exceptional $63,498 |
| Soviet Union | 100.0 /100 | #32 | Exceptional $63,382 |
| Immigrants | Lithuania | 100.0 /100 | #33 | Exceptional $63,346 |
| Immigrants | Russia | 100.0 /100 | #34 | Exceptional $63,326 |
| Immigrants | Asia | 100.0 /100 | #35 | Exceptional $63,240 |
| Israelis | 100.0 /100 | #36 | Exceptional $63,228 |
| Immigrants | Sri Lanka | 100.0 /100 | #37 | Exceptional $63,099 |
| Maltese | 100.0 /100 | #38 | Exceptional $62,953 |
| Immigrants | South Africa | 100.0 /100 | #39 | Exceptional $62,899 |
| Australians | 100.0 /100 | #40 | Exceptional $62,857 |
| Immigrants | Turkey | 100.0 /100 | #41 | Exceptional $62,728 |
| Immigrants | Greece | 100.0 /100 | #42 | Exceptional $62,689 |