Native/Alaskan vs Immigrants from Asia 11th Grade
COMPARE
Native/Alaskan
Immigrants from Asia
11th Grade
11th Grade Comparison
Natives/Alaskans
Immigrants from Asia
90.2%
11TH GRADE
0.0/ 100
METRIC RATING
293rd/ 347
METRIC RANK
92.4%
11TH GRADE
37.4/ 100
METRIC RATING
184th/ 347
METRIC RANK
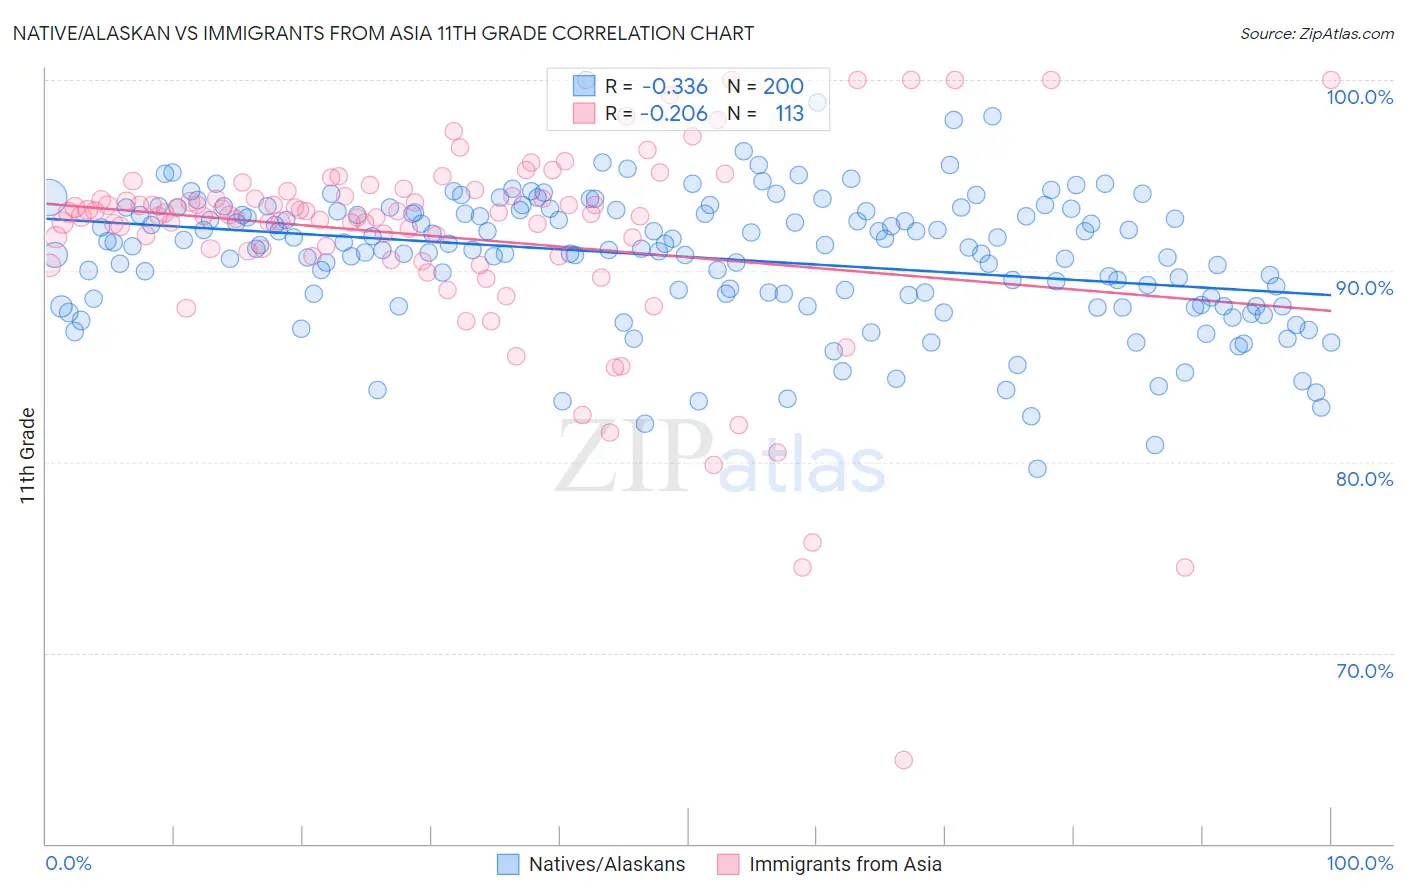
Native/Alaskan vs Immigrants from Asia 11th Grade Correlation Chart
The statistical analysis conducted on geographies consisting of 513,075,819 people shows a mild negative correlation between the proportion of Natives/Alaskans and percentage of population with at least 11th grade education in the United States with a correlation coefficient (R) of -0.336 and weighted average of 90.2%. Similarly, the statistical analysis conducted on geographies consisting of 549,170,438 people shows a weak negative correlation between the proportion of Immigrants from Asia and percentage of population with at least 11th grade education in the United States with a correlation coefficient (R) of -0.206 and weighted average of 92.4%, a difference of 2.5%.
11th Grade Correlation Summary
| Measurement | Native/Alaskan | Immigrants from Asia |
| Minimum | 79.7% | 64.4% |
| Maximum | 100.0% | 100.0% |
| Range | 20.3% | 35.6% |
| Mean | 90.7% | 91.8% |
| Median | 91.3% | 93.0% |
| Interquartile 25% (IQ1) | 88.7% | 90.9% |
| Interquartile 75% (IQ3) | 93.2% | 94.1% |
| Interquartile Range (IQR) | 4.5% | 3.1% |
| Standard Deviation (Sample) | 3.5% | 5.4% |
| Standard Deviation (Population) | 3.4% | 5.4% |
Similar Demographics by 11th Grade
Demographics Similar to Natives/Alaskans by 11th Grade
In terms of 11th grade, the demographic groups most similar to Natives/Alaskans are Immigrants from Grenada (90.1%, a difference of 0.050%), Cuban (90.2%, a difference of 0.070%), Haitian (90.3%, a difference of 0.10%), Indonesian (90.3%, a difference of 0.14%), and Immigrants from Vietnam (90.0%, a difference of 0.15%).
| Demographics | Rating | Rank | 11th Grade |
| Immigrants | West Indies | 0.0 /100 | #286 | Tragic 90.4% |
| Apache | 0.0 /100 | #287 | Tragic 90.4% |
| Pennsylvania Germans | 0.0 /100 | #288 | Tragic 90.3% |
| British West Indians | 0.0 /100 | #289 | Tragic 90.3% |
| Indonesians | 0.0 /100 | #290 | Tragic 90.3% |
| Haitians | 0.0 /100 | #291 | Tragic 90.3% |
| Cubans | 0.0 /100 | #292 | Tragic 90.2% |
| Natives/Alaskans | 0.0 /100 | #293 | Tragic 90.2% |
| Immigrants | Grenada | 0.0 /100 | #294 | Tragic 90.1% |
| Immigrants | Vietnam | 0.0 /100 | #295 | Tragic 90.0% |
| Fijians | 0.0 /100 | #296 | Tragic 90.0% |
| Navajo | 0.0 /100 | #297 | Tragic 90.0% |
| Immigrants | Fiji | 0.0 /100 | #298 | Tragic 89.9% |
| Japanese | 0.0 /100 | #299 | Tragic 89.9% |
| Immigrants | Haiti | 0.0 /100 | #300 | Tragic 89.9% |
Demographics Similar to Immigrants from Asia by 11th Grade
In terms of 11th grade, the demographic groups most similar to Immigrants from Asia are Immigrants from Malaysia (92.4%, a difference of 0.0%), Immigrants from Morocco (92.4%, a difference of 0.010%), Immigrants from Nepal (92.4%, a difference of 0.010%), Arapaho (92.4%, a difference of 0.020%), and Inupiat (92.4%, a difference of 0.030%).
| Demographics | Rating | Rank | 11th Grade |
| Guamanians/Chamorros | 45.0 /100 | #177 | Average 92.5% |
| Sudanese | 43.4 /100 | #178 | Average 92.5% |
| Creek | 40.9 /100 | #179 | Average 92.4% |
| Inupiat | 40.7 /100 | #180 | Average 92.4% |
| Cherokee | 40.7 /100 | #181 | Average 92.4% |
| Immigrants | Morocco | 38.6 /100 | #182 | Fair 92.4% |
| Immigrants | Malaysia | 37.6 /100 | #183 | Fair 92.4% |
| Immigrants | Asia | 37.4 /100 | #184 | Fair 92.4% |
| Immigrants | Nepal | 36.4 /100 | #185 | Fair 92.4% |
| Arapaho | 35.1 /100 | #186 | Fair 92.4% |
| Immigrants | Western Asia | 35.0 /100 | #187 | Fair 92.4% |
| Immigrants | Indonesia | 33.7 /100 | #188 | Fair 92.4% |
| Immigrants | Chile | 33.3 /100 | #189 | Fair 92.4% |
| Chickasaw | 31.4 /100 | #190 | Fair 92.3% |
| French American Indians | 30.8 /100 | #191 | Fair 92.3% |