Native/Alaskan vs Immigrants from Asia 9th Grade
COMPARE
Native/Alaskan
Immigrants from Asia
9th Grade
9th Grade Comparison
Natives/Alaskans
Immigrants from Asia
93.9%
9TH GRADE
0.4/ 100
METRIC RATING
265th/ 347
METRIC RANK
94.4%
9TH GRADE
7.7/ 100
METRIC RATING
222nd/ 347
METRIC RANK
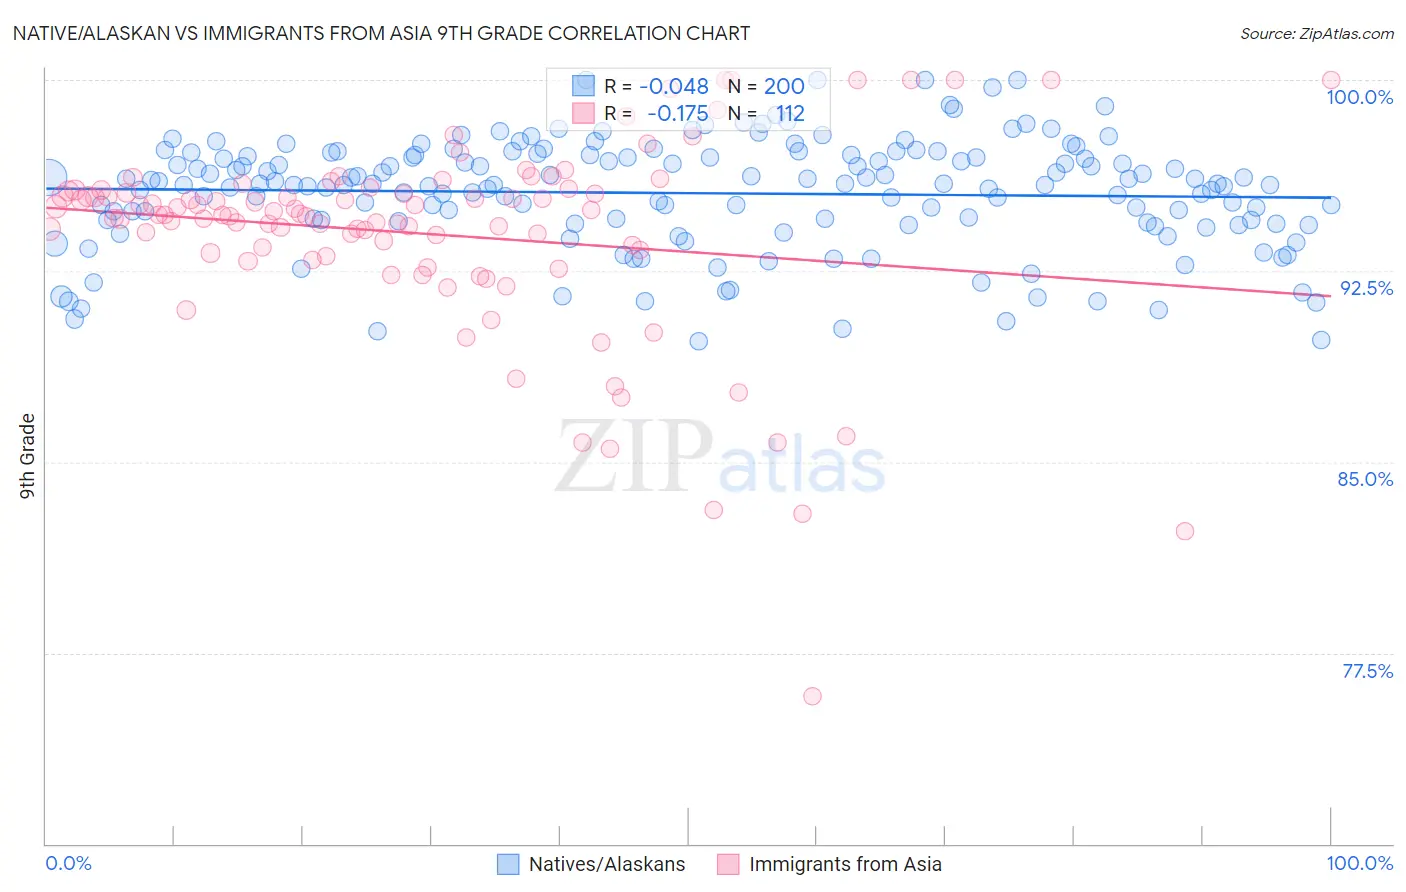
Native/Alaskan vs Immigrants from Asia 9th Grade Correlation Chart
The statistical analysis conducted on geographies consisting of 513,075,822 people shows no correlation between the proportion of Natives/Alaskans and percentage of population with at least 9th grade education in the United States with a correlation coefficient (R) of -0.048 and weighted average of 93.9%. Similarly, the statistical analysis conducted on geographies consisting of 549,167,442 people shows a poor negative correlation between the proportion of Immigrants from Asia and percentage of population with at least 9th grade education in the United States with a correlation coefficient (R) of -0.175 and weighted average of 94.4%, a difference of 0.58%.
9th Grade Correlation Summary
| Measurement | Native/Alaskan | Immigrants from Asia |
| Minimum | 89.8% | 75.8% |
| Maximum | 100.0% | 100.0% |
| Range | 10.2% | 24.2% |
| Mean | 95.6% | 93.9% |
| Median | 95.9% | 94.7% |
| Interquartile 25% (IQ1) | 94.4% | 93.1% |
| Interquartile 75% (IQ3) | 97.1% | 95.7% |
| Interquartile Range (IQR) | 2.6% | 2.5% |
| Standard Deviation (Sample) | 2.2% | 3.9% |
| Standard Deviation (Population) | 2.2% | 3.9% |
Similar Demographics by 9th Grade
Demographics Similar to Natives/Alaskans by 9th Grade
In terms of 9th grade, the demographic groups most similar to Natives/Alaskans are Immigrants from Congo (93.9%, a difference of 0.0%), Immigrants from Jamaica (93.9%, a difference of 0.010%), Immigrants from Uzbekistan (93.9%, a difference of 0.010%), Navajo (93.9%, a difference of 0.010%), and South American (93.9%, a difference of 0.030%).
| Demographics | Rating | Rank | 9th Grade |
| Immigrants | Thailand | 0.5 /100 | #258 | Tragic 93.9% |
| Ghanaians | 0.5 /100 | #259 | Tragic 93.9% |
| Pima | 0.4 /100 | #260 | Tragic 93.9% |
| South Americans | 0.4 /100 | #261 | Tragic 93.9% |
| Immigrants | Jamaica | 0.4 /100 | #262 | Tragic 93.9% |
| Immigrants | Uzbekistan | 0.4 /100 | #263 | Tragic 93.9% |
| Immigrants | Congo | 0.4 /100 | #264 | Tragic 93.9% |
| Natives/Alaskans | 0.4 /100 | #265 | Tragic 93.9% |
| Navajo | 0.3 /100 | #266 | Tragic 93.9% |
| Armenians | 0.3 /100 | #267 | Tragic 93.9% |
| Immigrants | Bolivia | 0.3 /100 | #268 | Tragic 93.9% |
| Immigrants | Uruguay | 0.2 /100 | #269 | Tragic 93.8% |
| Yuman | 0.2 /100 | #270 | Tragic 93.8% |
| Immigrants | Ghana | 0.2 /100 | #271 | Tragic 93.8% |
| Immigrants | Western Africa | 0.2 /100 | #272 | Tragic 93.8% |
Demographics Similar to Immigrants from Asia by 9th Grade
In terms of 9th grade, the demographic groups most similar to Immigrants from Asia are Immigrants from Eastern Africa (94.5%, a difference of 0.010%), Indian (Asian) (94.5%, a difference of 0.020%), Bahamian (94.4%, a difference of 0.020%), African (94.5%, a difference of 0.030%), and Portuguese (94.5%, a difference of 0.040%).
| Demographics | Rating | Rank | 9th Grade |
| Immigrants | Syria | 11.0 /100 | #215 | Poor 94.5% |
| Immigrants | Western Asia | 10.7 /100 | #216 | Poor 94.5% |
| Asians | 9.9 /100 | #217 | Tragic 94.5% |
| Portuguese | 9.2 /100 | #218 | Tragic 94.5% |
| Africans | 9.0 /100 | #219 | Tragic 94.5% |
| Indians (Asian) | 8.6 /100 | #220 | Tragic 94.5% |
| Immigrants | Eastern Africa | 8.2 /100 | #221 | Tragic 94.5% |
| Immigrants | Asia | 7.7 /100 | #222 | Tragic 94.4% |
| Bahamians | 7.0 /100 | #223 | Tragic 94.4% |
| Tongans | 6.0 /100 | #224 | Tragic 94.4% |
| Ethiopians | 5.4 /100 | #225 | Tragic 94.4% |
| Sub-Saharan Africans | 5.4 /100 | #226 | Tragic 94.4% |
| Immigrants | Sierra Leone | 4.8 /100 | #227 | Tragic 94.4% |
| Lumbee | 4.7 /100 | #228 | Tragic 94.4% |
| Immigrants | Southern Europe | 4.5 /100 | #229 | Tragic 94.3% |