Native/Alaskan vs Cuban Median Household Income
COMPARE
Native/Alaskan
Cuban
Median Household Income
Median Household Income Comparison
Natives/Alaskans
Cubans
$67,879
MEDIAN HOUSEHOLD INCOME
0.0/ 100
METRIC RATING
331st/ 347
METRIC RANK
$73,392
MEDIAN HOUSEHOLD INCOME
0.1/ 100
METRIC RATING
295th/ 347
METRIC RANK
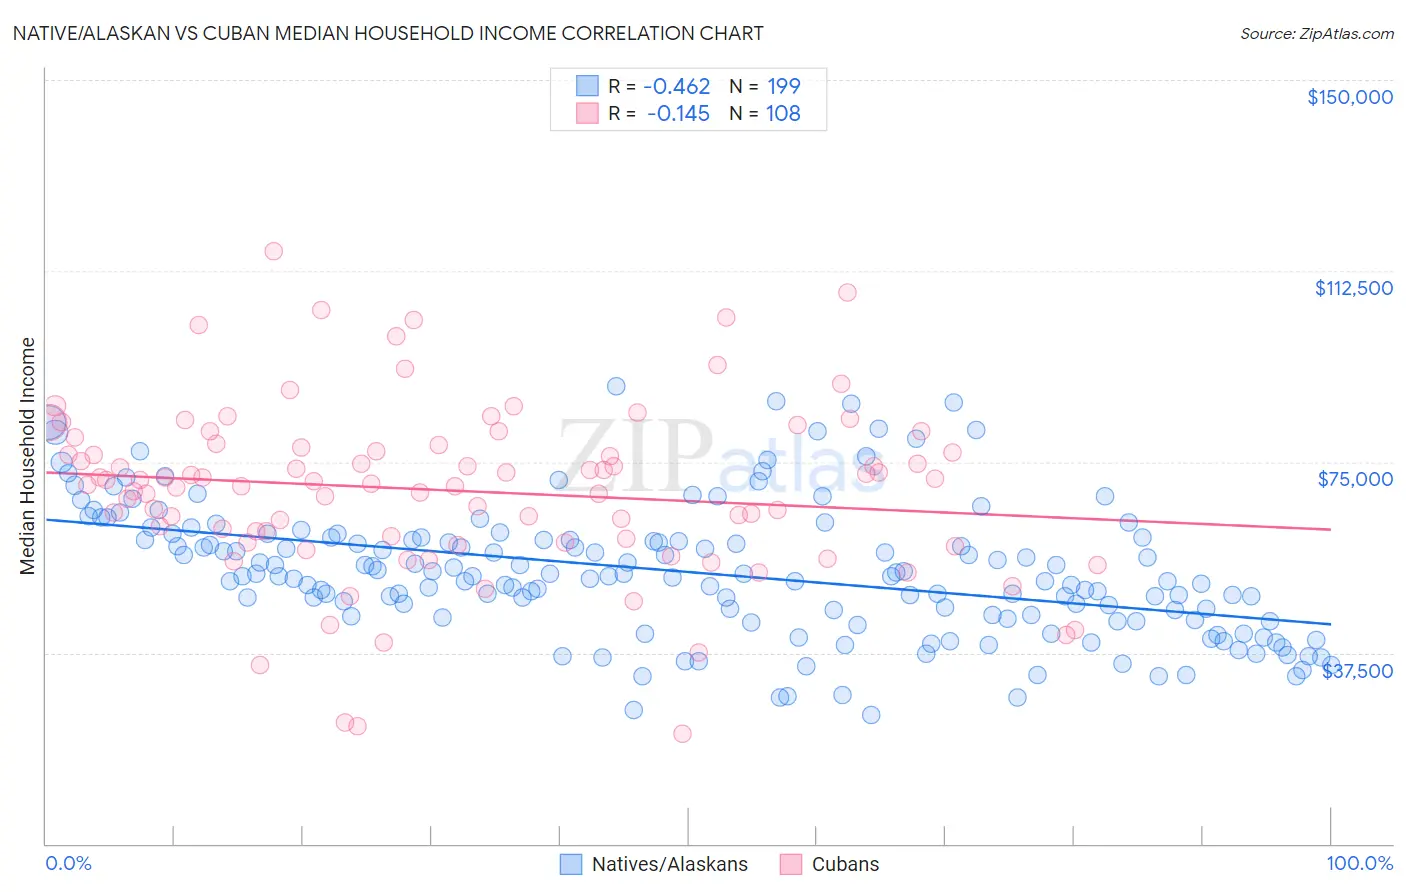
Native/Alaskan vs Cuban Median Household Income Correlation Chart
The statistical analysis conducted on geographies consisting of 512,383,553 people shows a moderate negative correlation between the proportion of Natives/Alaskans and median household income in the United States with a correlation coefficient (R) of -0.462 and weighted average of $67,879. Similarly, the statistical analysis conducted on geographies consisting of 448,852,866 people shows a poor negative correlation between the proportion of Cubans and median household income in the United States with a correlation coefficient (R) of -0.145 and weighted average of $73,392, a difference of 8.1%.
Median Household Income Correlation Summary
| Measurement | Native/Alaskan | Cuban |
| Minimum | $25,291 | $21,567 |
| Maximum | $89,884 | $116,431 |
| Range | $64,593 | $94,864 |
| Mean | $53,343 | $69,339 |
| Median | $52,617 | $70,955 |
| Interquartile 25% (IQ1) | $44,793 | $59,587 |
| Interquartile 75% (IQ3) | $60,078 | $78,118 |
| Interquartile Range (IQR) | $15,285 | $18,531 |
| Standard Deviation (Sample) | $12,918 | $17,087 |
| Standard Deviation (Population) | $12,886 | $17,007 |
Similar Demographics by Median Household Income
Demographics Similar to Natives/Alaskans by Median Household Income
In terms of median household income, the demographic groups most similar to Natives/Alaskans are Arapaho ($67,965, a difference of 0.13%), Sioux ($67,792, a difference of 0.13%), Creek ($67,715, a difference of 0.24%), Black/African American ($67,573, a difference of 0.45%), and Dutch West Indian ($68,412, a difference of 0.79%).
| Demographics | Rating | Rank | Median Household Income |
| Yup'ik | 0.0 /100 | #324 | Tragic $69,695 |
| Seminole | 0.0 /100 | #325 | Tragic $69,420 |
| Yuman | 0.0 /100 | #326 | Tragic $68,743 |
| Immigrants | Cuba | 0.0 /100 | #327 | Tragic $68,461 |
| Menominee | 0.0 /100 | #328 | Tragic $68,423 |
| Dutch West Indians | 0.0 /100 | #329 | Tragic $68,412 |
| Arapaho | 0.0 /100 | #330 | Tragic $67,965 |
| Natives/Alaskans | 0.0 /100 | #331 | Tragic $67,879 |
| Sioux | 0.0 /100 | #332 | Tragic $67,792 |
| Creek | 0.0 /100 | #333 | Tragic $67,715 |
| Blacks/African Americans | 0.0 /100 | #334 | Tragic $67,573 |
| Cheyenne | 0.0 /100 | #335 | Tragic $66,974 |
| Immigrants | Congo | 0.0 /100 | #336 | Tragic $66,768 |
| Kiowa | 0.0 /100 | #337 | Tragic $65,914 |
| Immigrants | Yemen | 0.0 /100 | #338 | Tragic $65,194 |
Demographics Similar to Cubans by Median Household Income
In terms of median household income, the demographic groups most similar to Cubans are Haitian ($73,306, a difference of 0.12%), Blackfeet ($73,509, a difference of 0.16%), Immigrants from Cabo Verde ($73,515, a difference of 0.17%), Immigrants from Mexico ($73,160, a difference of 0.32%), and Comanche ($73,747, a difference of 0.48%).
| Demographics | Rating | Rank | Median Household Income |
| Immigrants | Central America | 0.1 /100 | #288 | Tragic $74,217 |
| Fijians | 0.1 /100 | #289 | Tragic $74,205 |
| Bangladeshis | 0.1 /100 | #290 | Tragic $74,112 |
| Hispanics or Latinos | 0.1 /100 | #291 | Tragic $73,823 |
| Comanche | 0.1 /100 | #292 | Tragic $73,747 |
| Immigrants | Cabo Verde | 0.1 /100 | #293 | Tragic $73,515 |
| Blackfeet | 0.1 /100 | #294 | Tragic $73,509 |
| Cubans | 0.1 /100 | #295 | Tragic $73,392 |
| Haitians | 0.1 /100 | #296 | Tragic $73,306 |
| Immigrants | Mexico | 0.0 /100 | #297 | Tragic $73,160 |
| Paiute | 0.0 /100 | #298 | Tragic $72,959 |
| Indonesians | 0.0 /100 | #299 | Tragic $72,856 |
| Immigrants | Dominica | 0.0 /100 | #300 | Tragic $72,760 |
| Cherokee | 0.0 /100 | #301 | Tragic $72,682 |
| Shoshone | 0.0 /100 | #302 | Tragic $72,660 |