Haitian vs Cuban Median Household Income
COMPARE
Haitian
Cuban
Median Household Income
Median Household Income Comparison
Haitians
Cubans
$73,306
MEDIAN HOUSEHOLD INCOME
0.1/ 100
METRIC RATING
296th/ 347
METRIC RANK
$73,392
MEDIAN HOUSEHOLD INCOME
0.1/ 100
METRIC RATING
295th/ 347
METRIC RANK
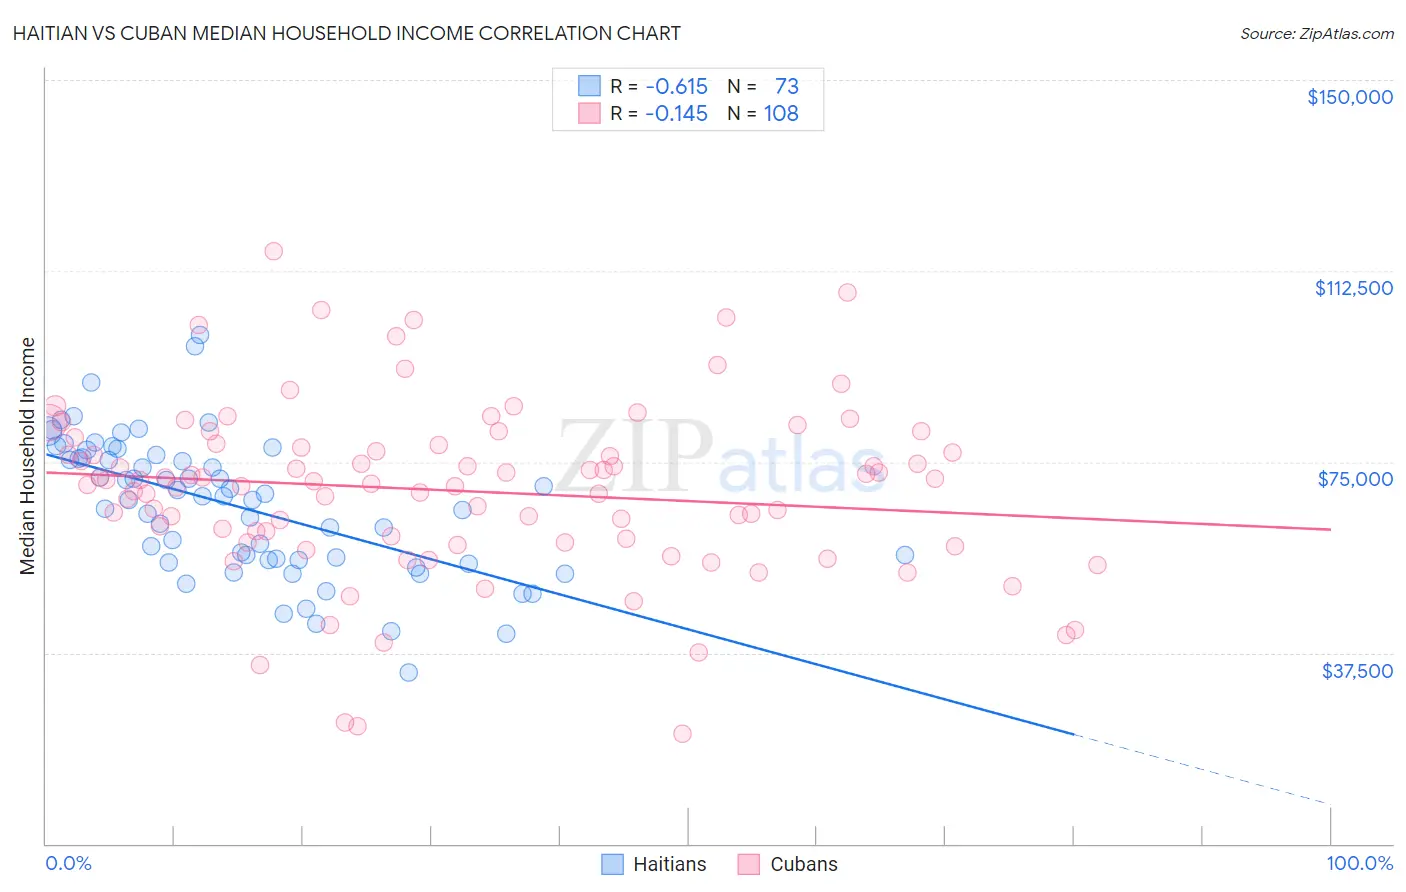
Haitian vs Cuban Median Household Income Correlation Chart
The statistical analysis conducted on geographies consisting of 287,615,576 people shows a significant negative correlation between the proportion of Haitians and median household income in the United States with a correlation coefficient (R) of -0.615 and weighted average of $73,306. Similarly, the statistical analysis conducted on geographies consisting of 448,852,866 people shows a poor negative correlation between the proportion of Cubans and median household income in the United States with a correlation coefficient (R) of -0.145 and weighted average of $73,392, a difference of 0.12%.
Median Household Income Correlation Summary
| Measurement | Haitian | Cuban |
| Minimum | $33,629 | $21,567 |
| Maximum | $99,911 | $116,431 |
| Range | $66,282 | $94,864 |
| Mean | $66,249 | $69,339 |
| Median | $68,171 | $70,955 |
| Interquartile 25% (IQ1) | $55,796 | $59,587 |
| Interquartile 75% (IQ3) | $76,109 | $78,118 |
| Interquartile Range (IQR) | $20,312 | $18,531 |
| Standard Deviation (Sample) | $13,488 | $17,087 |
| Standard Deviation (Population) | $13,395 | $17,007 |
Demographics Similar to Haitians and Cubans by Median Household Income
In terms of median household income, the demographic groups most similar to Haitians are Immigrants from Mexico ($73,160, a difference of 0.20%), Blackfeet ($73,509, a difference of 0.28%), Immigrants from Cabo Verde ($73,515, a difference of 0.29%), Paiute ($72,959, a difference of 0.48%), and Comanche ($73,747, a difference of 0.60%). Similarly, the demographic groups most similar to Cubans are Blackfeet ($73,509, a difference of 0.16%), Immigrants from Cabo Verde ($73,515, a difference of 0.17%), Immigrants from Mexico ($73,160, a difference of 0.32%), Comanche ($73,747, a difference of 0.48%), and Hispanic or Latino ($73,823, a difference of 0.59%).
| Demographics | Rating | Rank | Median Household Income |
| Mexicans | 0.1 /100 | #285 | Tragic $74,399 |
| Immigrants | Somalia | 0.1 /100 | #286 | Tragic $74,300 |
| Iroquois | 0.1 /100 | #287 | Tragic $74,279 |
| Immigrants | Central America | 0.1 /100 | #288 | Tragic $74,217 |
| Fijians | 0.1 /100 | #289 | Tragic $74,205 |
| Bangladeshis | 0.1 /100 | #290 | Tragic $74,112 |
| Hispanics or Latinos | 0.1 /100 | #291 | Tragic $73,823 |
| Comanche | 0.1 /100 | #292 | Tragic $73,747 |
| Immigrants | Cabo Verde | 0.1 /100 | #293 | Tragic $73,515 |
| Blackfeet | 0.1 /100 | #294 | Tragic $73,509 |
| Cubans | 0.1 /100 | #295 | Tragic $73,392 |
| Haitians | 0.1 /100 | #296 | Tragic $73,306 |
| Immigrants | Mexico | 0.0 /100 | #297 | Tragic $73,160 |
| Paiute | 0.0 /100 | #298 | Tragic $72,959 |
| Indonesians | 0.0 /100 | #299 | Tragic $72,856 |
| Immigrants | Dominica | 0.0 /100 | #300 | Tragic $72,760 |
| Cherokee | 0.0 /100 | #301 | Tragic $72,682 |
| Shoshone | 0.0 /100 | #302 | Tragic $72,660 |
| Africans | 0.0 /100 | #303 | Tragic $72,650 |
| Immigrants | Haiti | 0.0 /100 | #304 | Tragic $72,599 |
| Hondurans | 0.0 /100 | #305 | Tragic $72,588 |