Dominican vs Cuban Median Household Income
COMPARE
Dominican
Cuban
Median Household Income
Median Household Income Comparison
Dominicans
Cubans
$71,302
MEDIAN HOUSEHOLD INCOME
0.0/ 100
METRIC RATING
314th/ 347
METRIC RANK
$73,392
MEDIAN HOUSEHOLD INCOME
0.1/ 100
METRIC RATING
295th/ 347
METRIC RANK
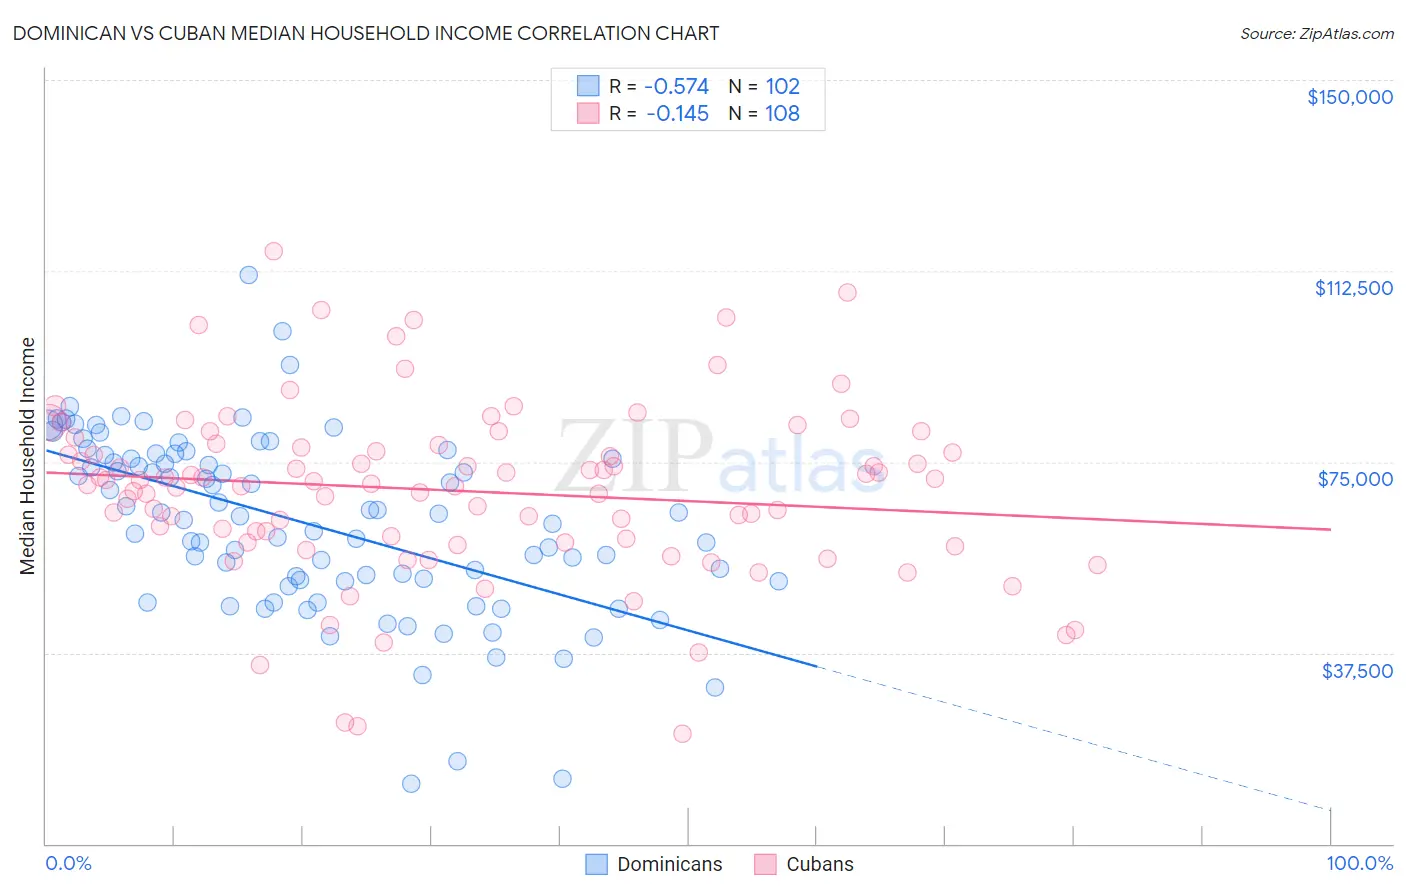
Dominican vs Cuban Median Household Income Correlation Chart
The statistical analysis conducted on geographies consisting of 354,675,302 people shows a substantial negative correlation between the proportion of Dominicans and median household income in the United States with a correlation coefficient (R) of -0.574 and weighted average of $71,302. Similarly, the statistical analysis conducted on geographies consisting of 448,852,866 people shows a poor negative correlation between the proportion of Cubans and median household income in the United States with a correlation coefficient (R) of -0.145 and weighted average of $73,392, a difference of 2.9%.
Median Household Income Correlation Summary
| Measurement | Dominican | Cuban |
| Minimum | $11,801 | $21,567 |
| Maximum | $111,701 | $116,431 |
| Range | $99,900 | $94,864 |
| Mean | $62,844 | $69,339 |
| Median | $64,590 | $70,955 |
| Interquartile 25% (IQ1) | $51,574 | $59,587 |
| Interquartile 75% (IQ3) | $76,260 | $78,118 |
| Interquartile Range (IQR) | $24,686 | $18,531 |
| Standard Deviation (Sample) | $17,716 | $17,087 |
| Standard Deviation (Population) | $17,629 | $17,007 |
Demographics Similar to Dominicans and Cubans by Median Household Income
In terms of median household income, the demographic groups most similar to Dominicans are Immigrants from Bahamas ($71,349, a difference of 0.060%), Immigrants from Honduras ($71,452, a difference of 0.21%), Immigrants from Zaire ($71,801, a difference of 0.70%), U.S. Virgin Islander ($71,853, a difference of 0.77%), and Immigrants from Caribbean ($71,860, a difference of 0.78%). Similarly, the demographic groups most similar to Cubans are Haitian ($73,306, a difference of 0.12%), Blackfeet ($73,509, a difference of 0.16%), Immigrants from Mexico ($73,160, a difference of 0.32%), Paiute ($72,959, a difference of 0.59%), and Indonesian ($72,856, a difference of 0.74%).
| Demographics | Rating | Rank | Median Household Income |
| Blackfeet | 0.1 /100 | #294 | Tragic $73,509 |
| Cubans | 0.1 /100 | #295 | Tragic $73,392 |
| Haitians | 0.1 /100 | #296 | Tragic $73,306 |
| Immigrants | Mexico | 0.0 /100 | #297 | Tragic $73,160 |
| Paiute | 0.0 /100 | #298 | Tragic $72,959 |
| Indonesians | 0.0 /100 | #299 | Tragic $72,856 |
| Immigrants | Dominica | 0.0 /100 | #300 | Tragic $72,760 |
| Cherokee | 0.0 /100 | #301 | Tragic $72,682 |
| Shoshone | 0.0 /100 | #302 | Tragic $72,660 |
| Africans | 0.0 /100 | #303 | Tragic $72,650 |
| Immigrants | Haiti | 0.0 /100 | #304 | Tragic $72,599 |
| Hondurans | 0.0 /100 | #305 | Tragic $72,588 |
| Potawatomi | 0.0 /100 | #306 | Tragic $72,576 |
| Ute | 0.0 /100 | #307 | Tragic $72,402 |
| Yakama | 0.0 /100 | #308 | Tragic $72,225 |
| Immigrants | Caribbean | 0.0 /100 | #309 | Tragic $71,860 |
| U.S. Virgin Islanders | 0.0 /100 | #310 | Tragic $71,853 |
| Immigrants | Zaire | 0.0 /100 | #311 | Tragic $71,801 |
| Immigrants | Honduras | 0.0 /100 | #312 | Tragic $71,452 |
| Immigrants | Bahamas | 0.0 /100 | #313 | Tragic $71,349 |
| Dominicans | 0.0 /100 | #314 | Tragic $71,302 |