Native/Alaskan vs South American Indian Median Household Income
COMPARE
Native/Alaskan
South American Indian
Median Household Income
Median Household Income Comparison
Natives/Alaskans
South American Indians
$67,879
MEDIAN HOUSEHOLD INCOME
0.0/ 100
METRIC RATING
331st/ 347
METRIC RANK
$87,446
MEDIAN HOUSEHOLD INCOME
81.8/ 100
METRIC RATING
147th/ 347
METRIC RANK
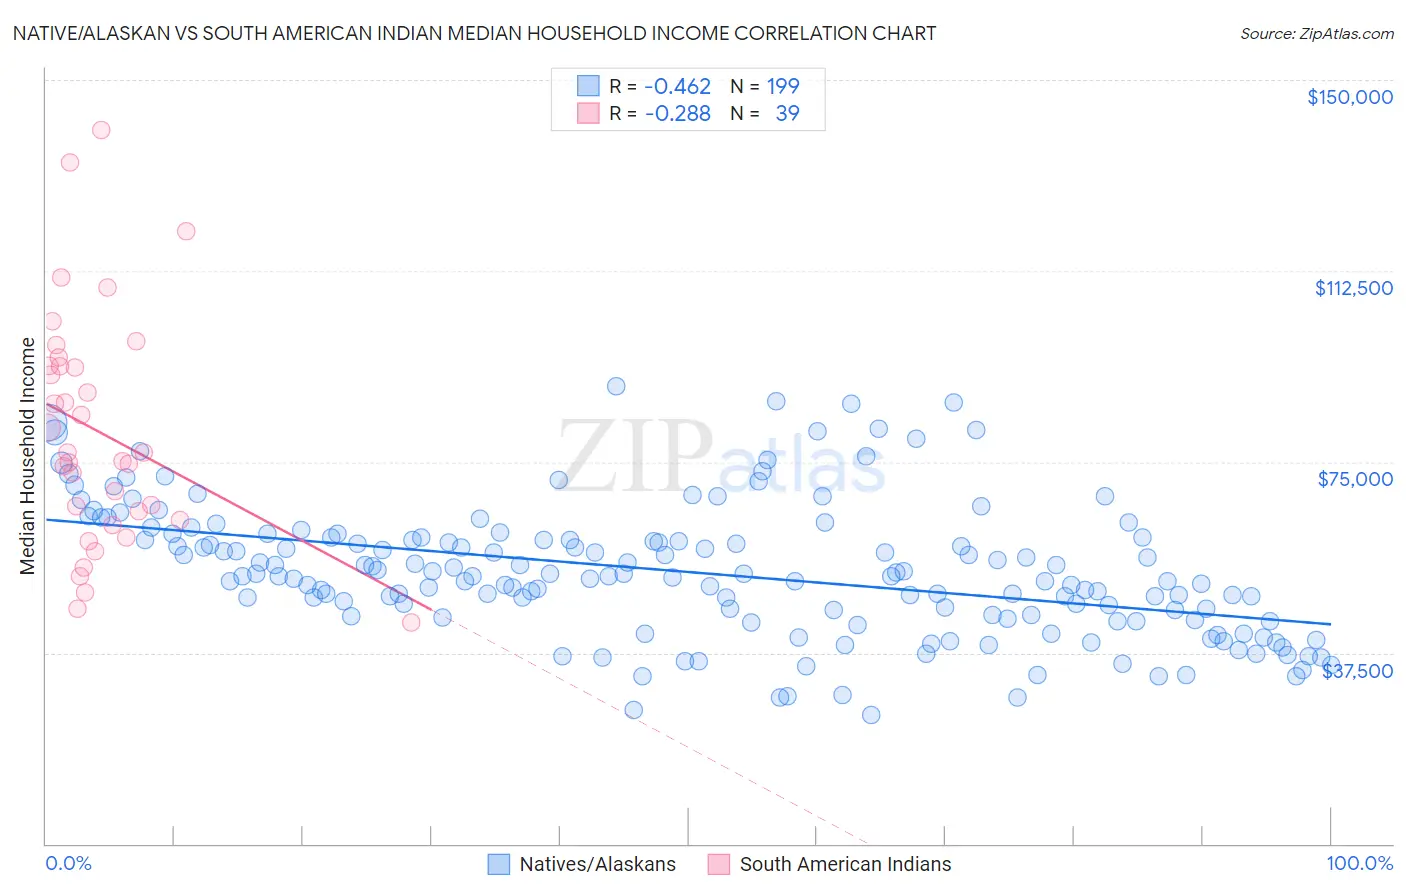
Native/Alaskan vs South American Indian Median Household Income Correlation Chart
The statistical analysis conducted on geographies consisting of 512,383,553 people shows a moderate negative correlation between the proportion of Natives/Alaskans and median household income in the United States with a correlation coefficient (R) of -0.462 and weighted average of $67,879. Similarly, the statistical analysis conducted on geographies consisting of 164,527,157 people shows a weak negative correlation between the proportion of South American Indians and median household income in the United States with a correlation coefficient (R) of -0.288 and weighted average of $87,446, a difference of 28.8%.
Median Household Income Correlation Summary
| Measurement | Native/Alaskan | South American Indian |
| Minimum | $25,291 | $43,438 |
| Maximum | $89,884 | $140,082 |
| Range | $64,593 | $96,644 |
| Mean | $53,343 | $80,839 |
| Median | $52,617 | $76,875 |
| Interquartile 25% (IQ1) | $44,793 | $63,676 |
| Interquartile 75% (IQ3) | $60,078 | $93,892 |
| Interquartile Range (IQR) | $15,285 | $30,216 |
| Standard Deviation (Sample) | $12,918 | $22,835 |
| Standard Deviation (Population) | $12,886 | $22,540 |
Similar Demographics by Median Household Income
Demographics Similar to Natives/Alaskans by Median Household Income
In terms of median household income, the demographic groups most similar to Natives/Alaskans are Arapaho ($67,965, a difference of 0.13%), Sioux ($67,792, a difference of 0.13%), Creek ($67,715, a difference of 0.24%), Black/African American ($67,573, a difference of 0.45%), and Dutch West Indian ($68,412, a difference of 0.79%).
| Demographics | Rating | Rank | Median Household Income |
| Yup'ik | 0.0 /100 | #324 | Tragic $69,695 |
| Seminole | 0.0 /100 | #325 | Tragic $69,420 |
| Yuman | 0.0 /100 | #326 | Tragic $68,743 |
| Immigrants | Cuba | 0.0 /100 | #327 | Tragic $68,461 |
| Menominee | 0.0 /100 | #328 | Tragic $68,423 |
| Dutch West Indians | 0.0 /100 | #329 | Tragic $68,412 |
| Arapaho | 0.0 /100 | #330 | Tragic $67,965 |
| Natives/Alaskans | 0.0 /100 | #331 | Tragic $67,879 |
| Sioux | 0.0 /100 | #332 | Tragic $67,792 |
| Creek | 0.0 /100 | #333 | Tragic $67,715 |
| Blacks/African Americans | 0.0 /100 | #334 | Tragic $67,573 |
| Cheyenne | 0.0 /100 | #335 | Tragic $66,974 |
| Immigrants | Congo | 0.0 /100 | #336 | Tragic $66,768 |
| Kiowa | 0.0 /100 | #337 | Tragic $65,914 |
| Immigrants | Yemen | 0.0 /100 | #338 | Tragic $65,194 |
Demographics Similar to South American Indians by Median Household Income
In terms of median household income, the demographic groups most similar to South American Indians are Immigrants from Uganda ($87,553, a difference of 0.12%), Ugandan ($87,557, a difference of 0.13%), Serbian ($87,572, a difference of 0.14%), Costa Rican ($87,262, a difference of 0.21%), and Danish ($87,676, a difference of 0.26%).
| Demographics | Rating | Rank | Median Household Income |
| Lebanese | 87.2 /100 | #140 | Excellent $88,091 |
| Immigrants | Morocco | 86.0 /100 | #141 | Excellent $87,930 |
| Canadians | 84.7 /100 | #142 | Excellent $87,769 |
| Danes | 83.9 /100 | #143 | Excellent $87,676 |
| Serbians | 83.0 /100 | #144 | Excellent $87,572 |
| Ugandans | 82.9 /100 | #145 | Excellent $87,557 |
| Immigrants | Uganda | 82.8 /100 | #146 | Excellent $87,553 |
| South American Indians | 81.8 /100 | #147 | Excellent $87,446 |
| Costa Ricans | 80.0 /100 | #148 | Excellent $87,262 |
| Immigrants | Nepal | 77.7 /100 | #149 | Good $87,046 |
| Basques | 77.2 /100 | #150 | Good $87,001 |
| Hungarians | 76.3 /100 | #151 | Good $86,920 |
| Immigrants | Saudi Arabia | 75.8 /100 | #152 | Good $86,875 |
| South Americans | 75.1 /100 | #153 | Good $86,824 |
| Immigrants | Germany | 74.4 /100 | #154 | Good $86,764 |