Menominee vs Immigrants from Eastern Asia Median Family Income
COMPARE
Menominee
Immigrants from Eastern Asia
Median Family Income
Median Family Income Comparison
Menominee
Immigrants from Eastern Asia
$79,563
MEDIAN FAMILY INCOME
0.0/ 100
METRIC RATING
334th/ 347
METRIC RANK
$125,150
MEDIAN FAMILY INCOME
100.0/ 100
METRIC RATING
18th/ 347
METRIC RANK
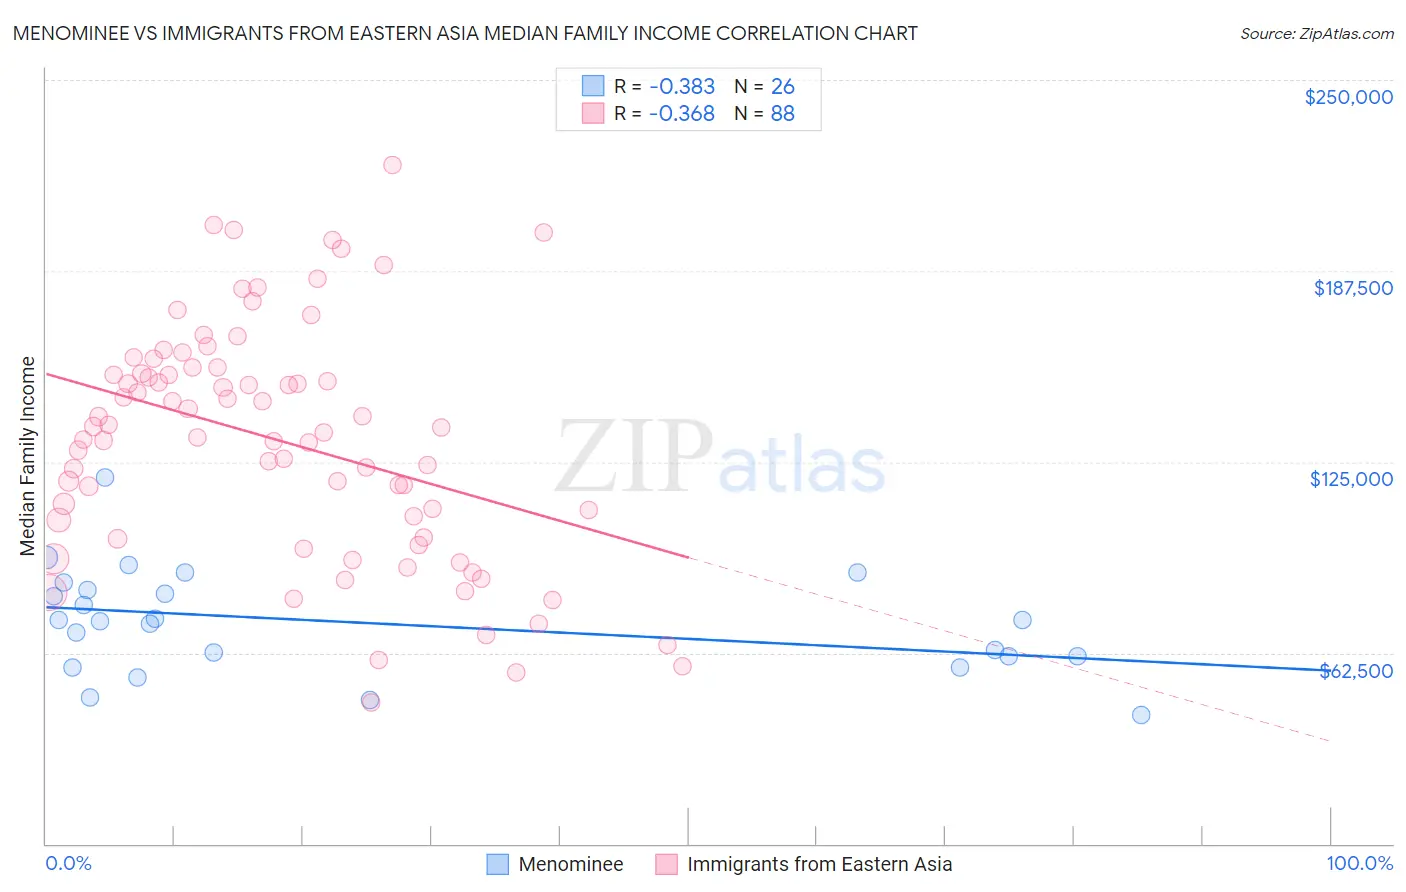
Menominee vs Immigrants from Eastern Asia Median Family Income Correlation Chart
The statistical analysis conducted on geographies consisting of 45,777,534 people shows a mild negative correlation between the proportion of Menominee and median family income in the United States with a correlation coefficient (R) of -0.383 and weighted average of $79,563. Similarly, the statistical analysis conducted on geographies consisting of 499,115,176 people shows a mild negative correlation between the proportion of Immigrants from Eastern Asia and median family income in the United States with a correlation coefficient (R) of -0.368 and weighted average of $125,150, a difference of 57.3%.
Median Family Income Correlation Summary
| Measurement | Menominee | Immigrants from Eastern Asia |
| Minimum | $41,944 | $46,207 |
| Maximum | $119,750 | $222,159 |
| Range | $77,806 | $175,952 |
| Mean | $72,340 | $131,947 |
| Median | $72,940 | $135,368 |
| Interquartile 25% (IQ1) | $61,250 | $103,059 |
| Interquartile 75% (IQ3) | $83,264 | $154,860 |
| Interquartile Range (IQR) | $22,014 | $51,801 |
| Standard Deviation (Sample) | $17,229 | $38,302 |
| Standard Deviation (Population) | $16,895 | $38,084 |
Similar Demographics by Median Family Income
Demographics Similar to Menominee by Median Family Income
In terms of median family income, the demographic groups most similar to Menominee are Yup'ik ($79,290, a difference of 0.34%), Kiowa ($80,885, a difference of 1.7%), Immigrants from Cuba ($78,249, a difference of 1.7%), Native/Alaskan ($80,908, a difference of 1.7%), and Yuman ($78,055, a difference of 1.9%).
| Demographics | Rating | Rank | Median Family Income |
| Arapaho | 0.0 /100 | #327 | Tragic $82,064 |
| Blacks/African Americans | 0.0 /100 | #328 | Tragic $81,912 |
| Dutch West Indians | 0.0 /100 | #329 | Tragic $81,852 |
| Cheyenne | 0.0 /100 | #330 | Tragic $81,385 |
| Immigrants | Dominican Republic | 0.0 /100 | #331 | Tragic $81,233 |
| Natives/Alaskans | 0.0 /100 | #332 | Tragic $80,908 |
| Kiowa | 0.0 /100 | #333 | Tragic $80,885 |
| Menominee | 0.0 /100 | #334 | Tragic $79,563 |
| Yup'ik | 0.0 /100 | #335 | Tragic $79,290 |
| Immigrants | Cuba | 0.0 /100 | #336 | Tragic $78,249 |
| Yuman | 0.0 /100 | #337 | Tragic $78,055 |
| Immigrants | Yemen | 0.0 /100 | #338 | Tragic $77,457 |
| Pima | 0.0 /100 | #339 | Tragic $77,431 |
| Hopi | 0.0 /100 | #340 | Tragic $77,188 |
| Pueblo | 0.0 /100 | #341 | Tragic $76,880 |
Demographics Similar to Immigrants from Eastern Asia by Median Family Income
In terms of median family income, the demographic groups most similar to Immigrants from Eastern Asia are Indian (Asian) ($125,312, a difference of 0.13%), Immigrants from China ($125,540, a difference of 0.31%), Eastern European ($125,546, a difference of 0.32%), Immigrants from South Central Asia ($125,956, a difference of 0.64%), and Immigrants from Belgium ($123,831, a difference of 1.1%).
| Demographics | Rating | Rank | Median Family Income |
| Immigrants | Israel | 100.0 /100 | #11 | Exceptional $127,430 |
| Cypriots | 100.0 /100 | #12 | Exceptional $127,064 |
| Immigrants | Australia | 100.0 /100 | #13 | Exceptional $126,620 |
| Immigrants | South Central Asia | 100.0 /100 | #14 | Exceptional $125,956 |
| Eastern Europeans | 100.0 /100 | #15 | Exceptional $125,546 |
| Immigrants | China | 100.0 /100 | #16 | Exceptional $125,540 |
| Indians (Asian) | 100.0 /100 | #17 | Exceptional $125,312 |
| Immigrants | Eastern Asia | 100.0 /100 | #18 | Exceptional $125,150 |
| Immigrants | Belgium | 100.0 /100 | #19 | Exceptional $123,831 |
| Burmese | 100.0 /100 | #20 | Exceptional $123,369 |
| Immigrants | Korea | 100.0 /100 | #21 | Exceptional $122,800 |
| Immigrants | Sweden | 100.0 /100 | #22 | Exceptional $122,765 |
| Immigrants | Japan | 100.0 /100 | #23 | Exceptional $122,764 |
| Immigrants | Northern Europe | 100.0 /100 | #24 | Exceptional $121,840 |
| Turks | 100.0 /100 | #25 | Exceptional $121,202 |