Marshallese vs Immigrants from West Indies Wage/Income Gap
COMPARE
Marshallese
Immigrants from West Indies
Wage/Income Gap
Wage/Income Gap Comparison
Marshallese
Immigrants from West Indies
23.4%
WAGE/INCOME GAP
99.6/ 100
METRIC RATING
89th/ 347
METRIC RANK
19.2%
WAGE/INCOME GAP
100.0/ 100
METRIC RATING
12th/ 347
METRIC RANK
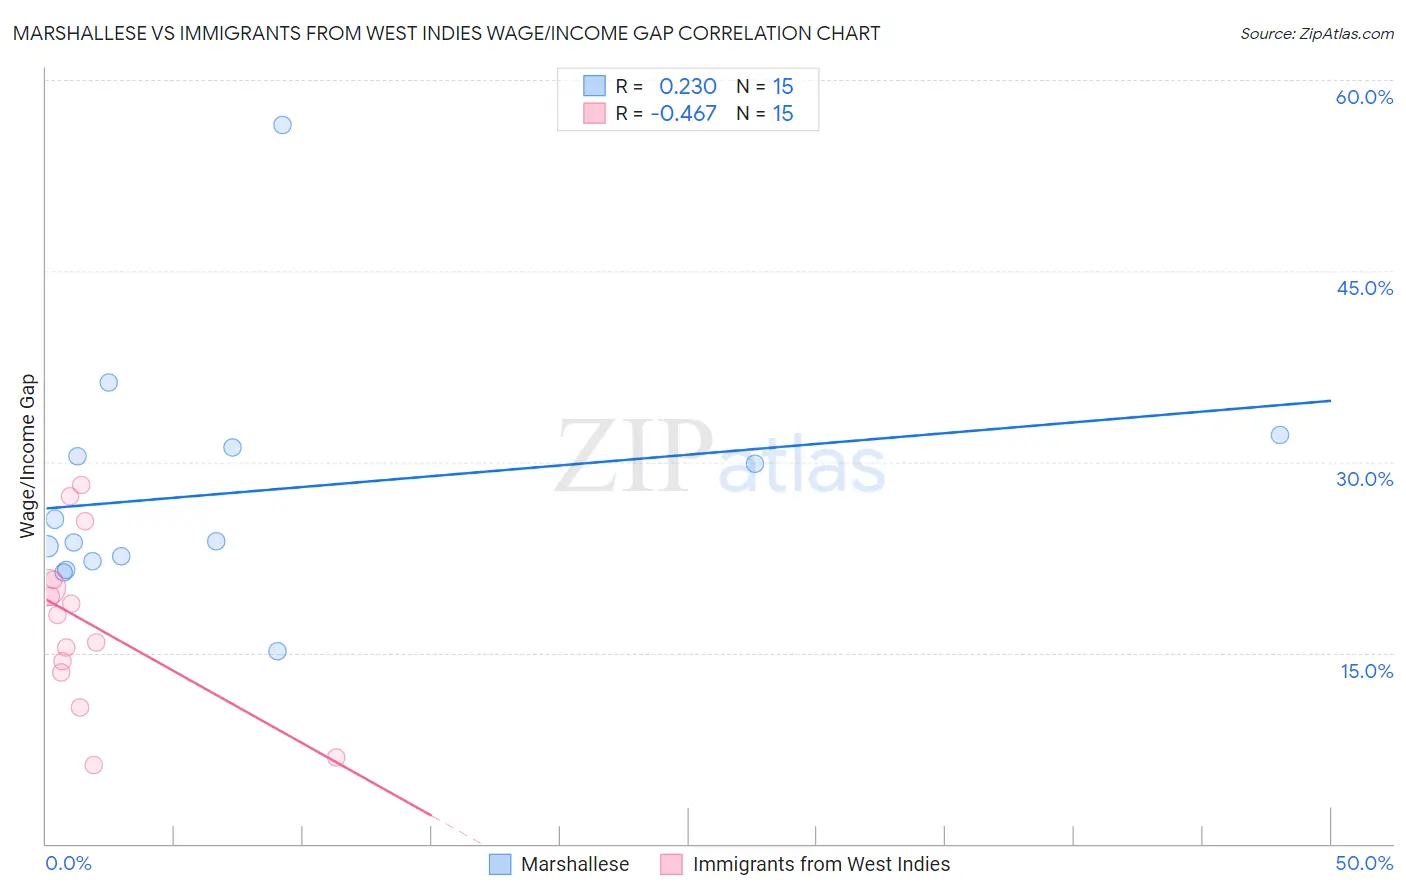
Marshallese vs Immigrants from West Indies Wage/Income Gap Correlation Chart
The statistical analysis conducted on geographies consisting of 14,760,329 people shows a weak positive correlation between the proportion of Marshallese and wage/income gap percentage in the United States with a correlation coefficient (R) of 0.230 and weighted average of 23.4%. Similarly, the statistical analysis conducted on geographies consisting of 72,447,771 people shows a moderate negative correlation between the proportion of Immigrants from West Indies and wage/income gap percentage in the United States with a correlation coefficient (R) of -0.467 and weighted average of 19.2%, a difference of 21.8%.
Wage/Income Gap Correlation Summary
| Measurement | Marshallese | Immigrants from West Indies |
| Minimum | 15.1% | 6.2% |
| Maximum | 56.5% | 28.2% |
| Range | 41.4% | 21.9% |
| Mean | 27.7% | 17.4% |
| Median | 23.7% | 18.0% |
| Interquartile 25% (IQ1) | 22.2% | 13.4% |
| Interquartile 75% (IQ3) | 31.2% | 20.7% |
| Interquartile Range (IQR) | 8.9% | 7.3% |
| Standard Deviation (Sample) | 9.6% | 6.6% |
| Standard Deviation (Population) | 9.3% | 6.4% |
Similar Demographics by Wage/Income Gap
Demographics Similar to Marshallese by Wage/Income Gap
In terms of wage/income gap, the demographic groups most similar to Marshallese are Nicaraguan (23.4%, a difference of 0.010%), Immigrants from Panama (23.4%, a difference of 0.090%), Arapaho (23.5%, a difference of 0.15%), Immigrants from Honduras (23.5%, a difference of 0.30%), and Yuman (23.3%, a difference of 0.41%).
| Demographics | Rating | Rank | Wage/Income Gap |
| Central Americans | 99.8 /100 | #82 | Exceptional 23.1% |
| Immigrants | Africa | 99.8 /100 | #83 | Exceptional 23.2% |
| Cubans | 99.7 /100 | #84 | Exceptional 23.3% |
| Immigrants | Cambodia | 99.7 /100 | #85 | Exceptional 23.3% |
| Cheyenne | 99.7 /100 | #86 | Exceptional 23.3% |
| Yuman | 99.7 /100 | #87 | Exceptional 23.3% |
| Immigrants | Panama | 99.6 /100 | #88 | Exceptional 23.4% |
| Marshallese | 99.6 /100 | #89 | Exceptional 23.4% |
| Nicaraguans | 99.6 /100 | #90 | Exceptional 23.4% |
| Arapaho | 99.6 /100 | #91 | Exceptional 23.5% |
| Immigrants | Honduras | 99.5 /100 | #92 | Exceptional 23.5% |
| Immigrants | Cabo Verde | 99.5 /100 | #93 | Exceptional 23.6% |
| Hondurans | 99.5 /100 | #94 | Exceptional 23.6% |
| Cape Verdeans | 99.4 /100 | #95 | Exceptional 23.6% |
| Kiowa | 99.4 /100 | #96 | Exceptional 23.6% |
Demographics Similar to Immigrants from West Indies by Wage/Income Gap
In terms of wage/income gap, the demographic groups most similar to Immigrants from West Indies are Immigrants from Haiti (19.2%, a difference of 0.11%), Trinidadian and Tobagonian (19.3%, a difference of 0.48%), Immigrants from Trinidad and Tobago (19.3%, a difference of 0.53%), Crow (19.1%, a difference of 0.90%), and Barbadian (19.0%, a difference of 1.4%).
| Demographics | Rating | Rank | Wage/Income Gap |
| Guyanese | 100.0 /100 | #5 | Exceptional 18.3% |
| Immigrants | Guyana | 100.0 /100 | #6 | Exceptional 18.4% |
| Puerto Ricans | 100.0 /100 | #7 | Exceptional 18.7% |
| Immigrants | Jamaica | 100.0 /100 | #8 | Exceptional 18.8% |
| Barbadians | 100.0 /100 | #9 | Exceptional 19.0% |
| Crow | 100.0 /100 | #10 | Exceptional 19.1% |
| Immigrants | Haiti | 100.0 /100 | #11 | Exceptional 19.2% |
| Immigrants | West Indies | 100.0 /100 | #12 | Exceptional 19.2% |
| Trinidadians and Tobagonians | 100.0 /100 | #13 | Exceptional 19.3% |
| Immigrants | Trinidad and Tobago | 100.0 /100 | #14 | Exceptional 19.3% |
| West Indians | 100.0 /100 | #15 | Exceptional 19.6% |
| Jamaicans | 100.0 /100 | #16 | Exceptional 19.6% |
| Haitians | 100.0 /100 | #17 | Exceptional 19.7% |
| Hopi | 100.0 /100 | #18 | Exceptional 20.0% |
| Immigrants | Dominica | 100.0 /100 | #19 | Exceptional 20.0% |