Marshallese vs Lithuanian Wage/Income Gap
COMPARE
Marshallese
Lithuanian
Wage/Income Gap
Wage/Income Gap Comparison
Marshallese
Lithuanians
23.4%
WAGE/INCOME GAP
99.6/ 100
METRIC RATING
89th/ 347
METRIC RANK
28.7%
WAGE/INCOME GAP
0.1/ 100
METRIC RATING
316th/ 347
METRIC RANK
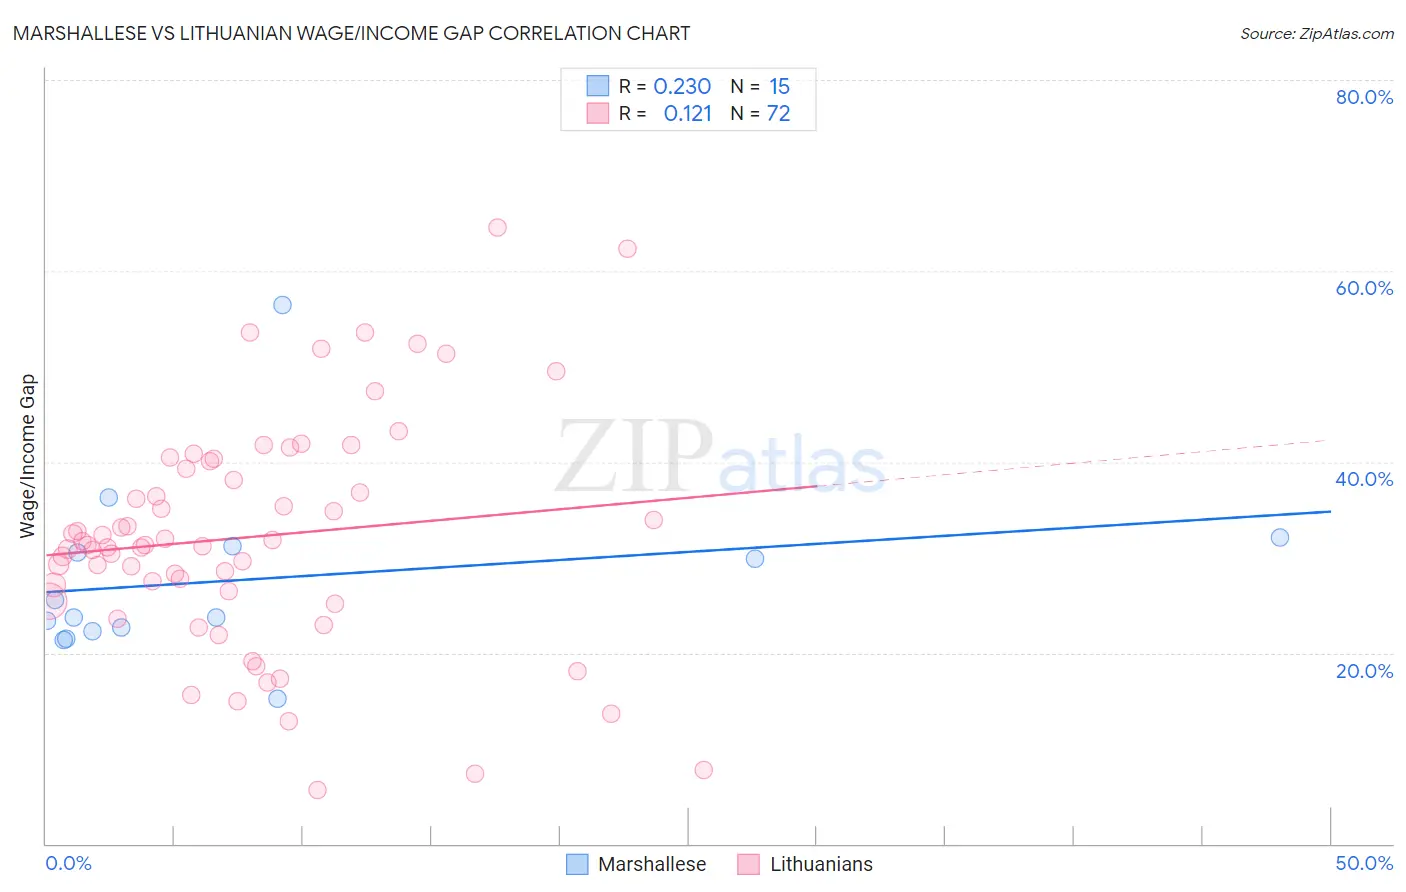
Marshallese vs Lithuanian Wage/Income Gap Correlation Chart
The statistical analysis conducted on geographies consisting of 14,760,329 people shows a weak positive correlation between the proportion of Marshallese and wage/income gap percentage in the United States with a correlation coefficient (R) of 0.230 and weighted average of 23.4%. Similarly, the statistical analysis conducted on geographies consisting of 421,511,979 people shows a poor positive correlation between the proportion of Lithuanians and wage/income gap percentage in the United States with a correlation coefficient (R) of 0.121 and weighted average of 28.7%, a difference of 22.7%.
Wage/Income Gap Correlation Summary
| Measurement | Marshallese | Lithuanian |
| Minimum | 15.1% | 5.6% |
| Maximum | 56.5% | 64.5% |
| Range | 41.4% | 58.9% |
| Mean | 27.7% | 32.1% |
| Median | 23.7% | 31.3% |
| Interquartile 25% (IQ1) | 22.2% | 25.9% |
| Interquartile 75% (IQ3) | 31.2% | 39.7% |
| Interquartile Range (IQR) | 8.9% | 13.8% |
| Standard Deviation (Sample) | 9.6% | 12.1% |
| Standard Deviation (Population) | 9.3% | 12.0% |
Similar Demographics by Wage/Income Gap
Demographics Similar to Marshallese by Wage/Income Gap
In terms of wage/income gap, the demographic groups most similar to Marshallese are Nicaraguan (23.4%, a difference of 0.010%), Immigrants from Panama (23.4%, a difference of 0.090%), Arapaho (23.5%, a difference of 0.15%), Immigrants from Honduras (23.5%, a difference of 0.30%), and Yuman (23.3%, a difference of 0.41%).
| Demographics | Rating | Rank | Wage/Income Gap |
| Central Americans | 99.8 /100 | #82 | Exceptional 23.1% |
| Immigrants | Africa | 99.8 /100 | #83 | Exceptional 23.2% |
| Cubans | 99.7 /100 | #84 | Exceptional 23.3% |
| Immigrants | Cambodia | 99.7 /100 | #85 | Exceptional 23.3% |
| Cheyenne | 99.7 /100 | #86 | Exceptional 23.3% |
| Yuman | 99.7 /100 | #87 | Exceptional 23.3% |
| Immigrants | Panama | 99.6 /100 | #88 | Exceptional 23.4% |
| Marshallese | 99.6 /100 | #89 | Exceptional 23.4% |
| Nicaraguans | 99.6 /100 | #90 | Exceptional 23.4% |
| Arapaho | 99.6 /100 | #91 | Exceptional 23.5% |
| Immigrants | Honduras | 99.5 /100 | #92 | Exceptional 23.5% |
| Immigrants | Cabo Verde | 99.5 /100 | #93 | Exceptional 23.6% |
| Hondurans | 99.5 /100 | #94 | Exceptional 23.6% |
| Cape Verdeans | 99.4 /100 | #95 | Exceptional 23.6% |
| Kiowa | 99.4 /100 | #96 | Exceptional 23.6% |
Demographics Similar to Lithuanians by Wage/Income Gap
In terms of wage/income gap, the demographic groups most similar to Lithuanians are Maltese (28.7%, a difference of 0.010%), Immigrants from Scotland (28.7%, a difference of 0.060%), Belgian (28.8%, a difference of 0.11%), Basque (28.8%, a difference of 0.16%), and French (28.7%, a difference of 0.20%).
| Demographics | Rating | Rank | Wage/Income Gap |
| Macedonians | 0.1 /100 | #309 | Tragic 28.6% |
| Finns | 0.1 /100 | #310 | Tragic 28.6% |
| Immigrants | Lithuania | 0.1 /100 | #311 | Tragic 28.6% |
| Eastern Europeans | 0.1 /100 | #312 | Tragic 28.6% |
| French | 0.1 /100 | #313 | Tragic 28.7% |
| Immigrants | Scotland | 0.1 /100 | #314 | Tragic 28.7% |
| Maltese | 0.1 /100 | #315 | Tragic 28.7% |
| Lithuanians | 0.1 /100 | #316 | Tragic 28.7% |
| Belgians | 0.1 /100 | #317 | Tragic 28.8% |
| Basques | 0.1 /100 | #318 | Tragic 28.8% |
| Slovaks | 0.1 /100 | #319 | Tragic 28.9% |
| British | 0.1 /100 | #320 | Tragic 28.9% |
| Welsh | 0.1 /100 | #321 | Tragic 28.9% |
| Immigrants | Singapore | 0.1 /100 | #322 | Tragic 28.9% |
| Norwegians | 0.1 /100 | #323 | Tragic 29.0% |