Cree vs Costa Rican Median Household Income
COMPARE
Cree
Costa Rican
Median Household Income
Median Household Income Comparison
Cree
Costa Ricans
$74,685
MEDIAN HOUSEHOLD INCOME
0.1/ 100
METRIC RATING
283rd/ 347
METRIC RANK
$87,262
MEDIAN HOUSEHOLD INCOME
80.0/ 100
METRIC RATING
148th/ 347
METRIC RANK
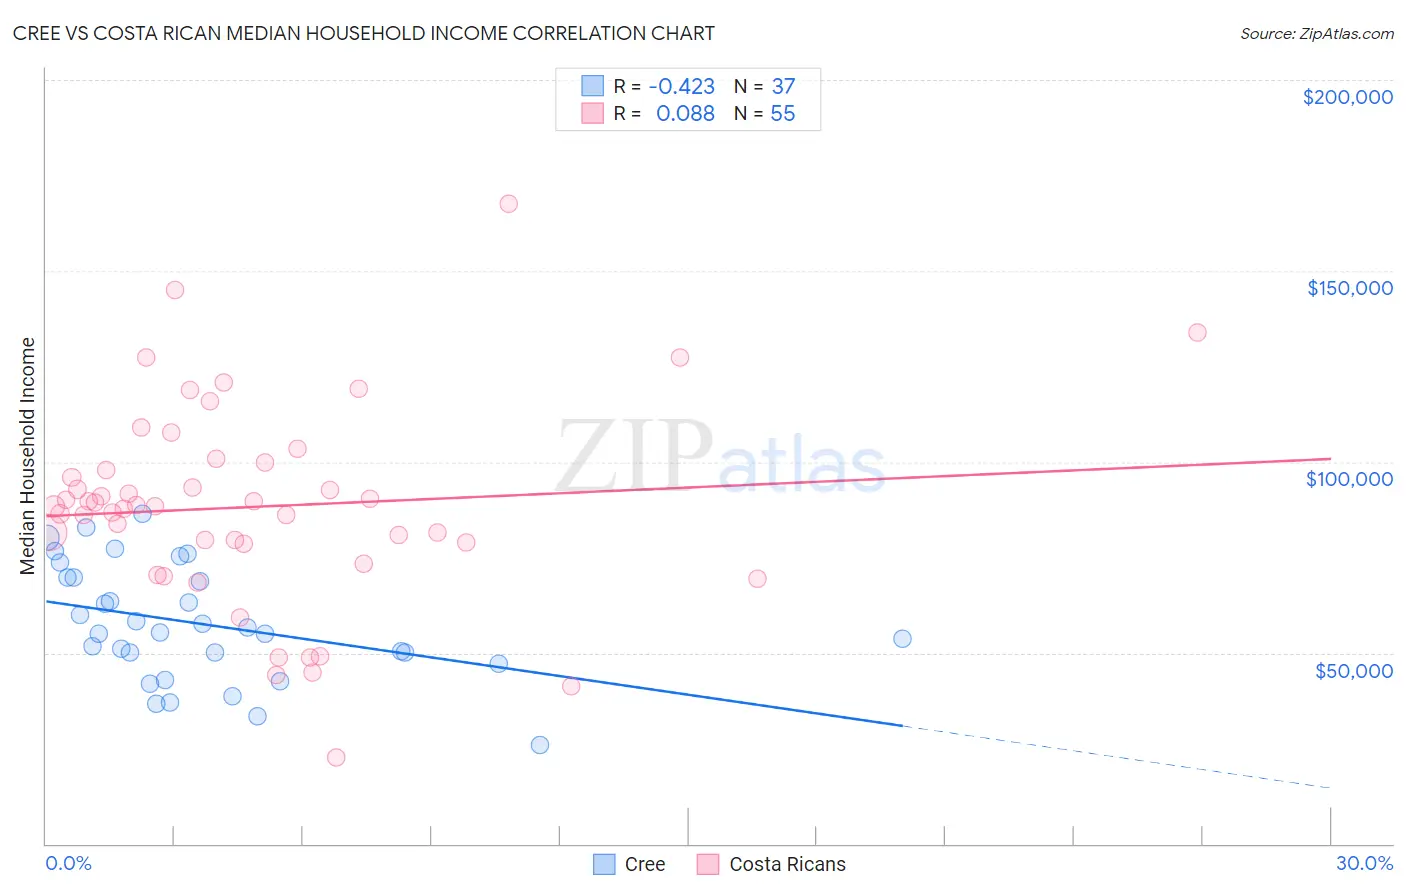
Cree vs Costa Rican Median Household Income Correlation Chart
The statistical analysis conducted on geographies consisting of 76,206,119 people shows a moderate negative correlation between the proportion of Cree and median household income in the United States with a correlation coefficient (R) of -0.423 and weighted average of $74,685. Similarly, the statistical analysis conducted on geographies consisting of 253,413,856 people shows a slight positive correlation between the proportion of Costa Ricans and median household income in the United States with a correlation coefficient (R) of 0.088 and weighted average of $87,262, a difference of 16.8%.
Median Household Income Correlation Summary
| Measurement | Cree | Costa Rican |
| Minimum | $25,833 | $22,708 |
| Maximum | $86,509 | $167,647 |
| Range | $60,676 | $144,939 |
| Mean | $57,468 | $88,260 |
| Median | $55,368 | $88,335 |
| Interquartile 25% (IQ1) | $48,609 | $78,591 |
| Interquartile 75% (IQ3) | $69,690 | $99,928 |
| Interquartile Range (IQR) | $21,081 | $21,337 |
| Standard Deviation (Sample) | $14,992 | $26,495 |
| Standard Deviation (Population) | $14,788 | $26,253 |
Similar Demographics by Median Household Income
Demographics Similar to Cree by Median Household Income
In terms of median household income, the demographic groups most similar to Cree are Yaqui ($74,596, a difference of 0.12%), Central American Indian ($74,847, a difference of 0.22%), Immigrants from Liberia ($74,896, a difference of 0.28%), Mexican ($74,399, a difference of 0.39%), and Senegalese ($74,999, a difference of 0.42%).
| Demographics | Rating | Rank | Median Household Income |
| Immigrants | Latin America | 0.2 /100 | #276 | Tragic $75,420 |
| Spanish Americans | 0.2 /100 | #277 | Tragic $75,386 |
| Osage | 0.2 /100 | #278 | Tragic $75,240 |
| Immigrants | Guatemala | 0.2 /100 | #279 | Tragic $75,123 |
| Senegalese | 0.2 /100 | #280 | Tragic $74,999 |
| Immigrants | Liberia | 0.1 /100 | #281 | Tragic $74,896 |
| Central American Indians | 0.1 /100 | #282 | Tragic $74,847 |
| Cree | 0.1 /100 | #283 | Tragic $74,685 |
| Yaqui | 0.1 /100 | #284 | Tragic $74,596 |
| Mexicans | 0.1 /100 | #285 | Tragic $74,399 |
| Immigrants | Somalia | 0.1 /100 | #286 | Tragic $74,300 |
| Iroquois | 0.1 /100 | #287 | Tragic $74,279 |
| Immigrants | Central America | 0.1 /100 | #288 | Tragic $74,217 |
| Fijians | 0.1 /100 | #289 | Tragic $74,205 |
| Bangladeshis | 0.1 /100 | #290 | Tragic $74,112 |
Demographics Similar to Costa Ricans by Median Household Income
In terms of median household income, the demographic groups most similar to Costa Ricans are South American Indian ($87,446, a difference of 0.21%), Immigrants from Nepal ($87,046, a difference of 0.25%), Basque ($87,001, a difference of 0.30%), Immigrants from Uganda ($87,553, a difference of 0.33%), and Ugandan ($87,557, a difference of 0.34%).
| Demographics | Rating | Rank | Median Household Income |
| Immigrants | Morocco | 86.0 /100 | #141 | Excellent $87,930 |
| Canadians | 84.7 /100 | #142 | Excellent $87,769 |
| Danes | 83.9 /100 | #143 | Excellent $87,676 |
| Serbians | 83.0 /100 | #144 | Excellent $87,572 |
| Ugandans | 82.9 /100 | #145 | Excellent $87,557 |
| Immigrants | Uganda | 82.8 /100 | #146 | Excellent $87,553 |
| South American Indians | 81.8 /100 | #147 | Excellent $87,446 |
| Costa Ricans | 80.0 /100 | #148 | Excellent $87,262 |
| Immigrants | Nepal | 77.7 /100 | #149 | Good $87,046 |
| Basques | 77.2 /100 | #150 | Good $87,001 |
| Hungarians | 76.3 /100 | #151 | Good $86,920 |
| Immigrants | Saudi Arabia | 75.8 /100 | #152 | Good $86,875 |
| South Americans | 75.1 /100 | #153 | Good $86,824 |
| Immigrants | Germany | 74.4 /100 | #154 | Good $86,764 |
| Carpatho Rusyns | 72.8 /100 | #155 | Good $86,635 |