Kenyan vs Alaskan Athabascan Median Female Earnings
COMPARE
Kenyan
Alaskan Athabascan
Median Female Earnings
Median Female Earnings Comparison
Kenyans
Alaskan Athabascans
$39,860
MEDIAN FEMALE EARNINGS
58.4/ 100
METRIC RATING
169th/ 347
METRIC RANK
$37,905
MEDIAN FEMALE EARNINGS
2.3/ 100
METRIC RATING
248th/ 347
METRIC RANK
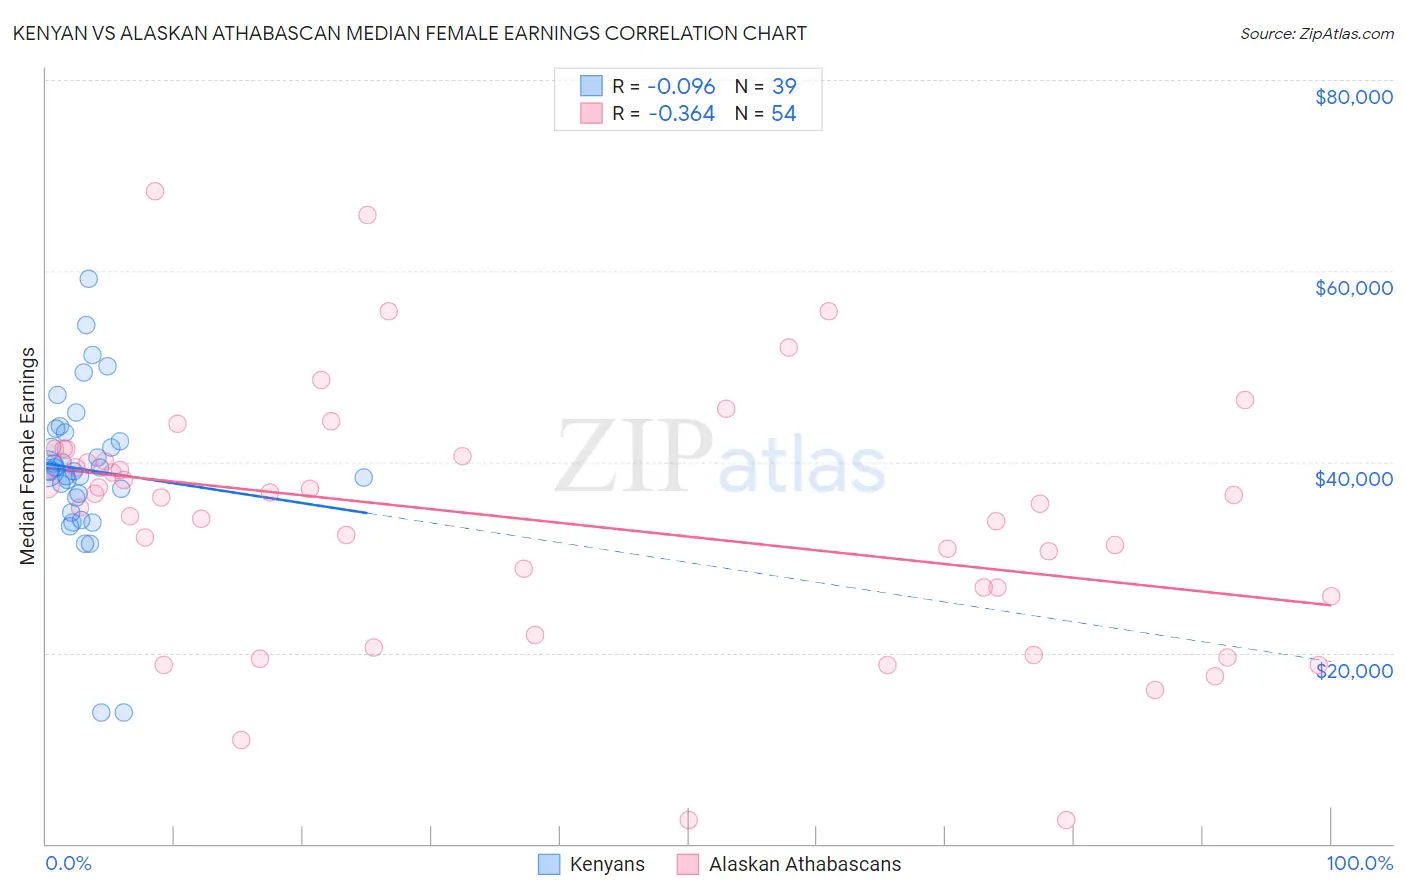
Kenyan vs Alaskan Athabascan Median Female Earnings Correlation Chart
The statistical analysis conducted on geographies consisting of 168,237,877 people shows a slight negative correlation between the proportion of Kenyans and median female earnings in the United States with a correlation coefficient (R) of -0.096 and weighted average of $39,860. Similarly, the statistical analysis conducted on geographies consisting of 45,800,514 people shows a mild negative correlation between the proportion of Alaskan Athabascans and median female earnings in the United States with a correlation coefficient (R) of -0.364 and weighted average of $37,905, a difference of 5.2%.
Median Female Earnings Correlation Summary
| Measurement | Kenyan | Alaskan Athabascan |
| Minimum | $13,750 | $2,499 |
| Maximum | $59,125 | $68,290 |
| Range | $45,375 | $65,791 |
| Mean | $39,183 | $33,896 |
| Median | $39,212 | $35,954 |
| Interquartile 25% (IQ1) | $36,279 | $25,923 |
| Interquartile 75% (IQ3) | $43,131 | $40,625 |
| Interquartile Range (IQR) | $6,851 | $14,702 |
| Standard Deviation (Sample) | $8,498 | $13,459 |
| Standard Deviation (Population) | $8,388 | $13,333 |
Similar Demographics by Median Female Earnings
Demographics Similar to Kenyans by Median Female Earnings
In terms of median female earnings, the demographic groups most similar to Kenyans are Immigrants from Peru ($39,871, a difference of 0.030%), Immigrants from Ghana ($39,894, a difference of 0.080%), Luxembourger ($39,891, a difference of 0.080%), Slovene ($39,817, a difference of 0.11%), and Immigrants from Bangladesh ($39,910, a difference of 0.12%).
| Demographics | Rating | Rank | Median Female Earnings |
| South American Indians | 66.1 /100 | #162 | Good $40,019 |
| Lebanese | 65.5 /100 | #163 | Good $40,006 |
| Immigrants | Saudi Arabia | 62.9 /100 | #164 | Good $39,952 |
| Immigrants | Bangladesh | 60.8 /100 | #165 | Good $39,910 |
| Immigrants | Ghana | 60.0 /100 | #166 | Good $39,894 |
| Luxembourgers | 59.9 /100 | #167 | Average $39,891 |
| Immigrants | Peru | 58.9 /100 | #168 | Average $39,871 |
| Kenyans | 58.4 /100 | #169 | Average $39,860 |
| Slovenes | 56.2 /100 | #170 | Average $39,817 |
| Immigrants | Portugal | 54.7 /100 | #171 | Average $39,788 |
| British | 53.8 /100 | #172 | Average $39,772 |
| Canadians | 51.4 /100 | #173 | Average $39,724 |
| South Americans | 50.0 /100 | #174 | Average $39,698 |
| Immigrants | South America | 47.2 /100 | #175 | Average $39,643 |
| Nigerians | 47.0 /100 | #176 | Average $39,641 |
Demographics Similar to Alaskan Athabascans by Median Female Earnings
In terms of median female earnings, the demographic groups most similar to Alaskan Athabascans are Swiss ($37,904, a difference of 0.0%), Immigrants from Somalia ($37,914, a difference of 0.020%), Immigrants from Iraq ($37,864, a difference of 0.11%), Welsh ($37,856, a difference of 0.13%), and Immigrants from Middle Africa ($37,965, a difference of 0.16%).
| Demographics | Rating | Rank | Median Female Earnings |
| Spanish | 3.5 /100 | #241 | Tragic $38,098 |
| Immigrants | Burma/Myanmar | 3.0 /100 | #242 | Tragic $38,028 |
| Germans | 2.8 /100 | #243 | Tragic $37,986 |
| Immigrants | Liberia | 2.7 /100 | #244 | Tragic $37,970 |
| Immigrants | Middle Africa | 2.7 /100 | #245 | Tragic $37,965 |
| Delaware | 2.6 /100 | #246 | Tragic $37,964 |
| Immigrants | Somalia | 2.4 /100 | #247 | Tragic $37,914 |
| Alaskan Athabascans | 2.3 /100 | #248 | Tragic $37,905 |
| Swiss | 2.3 /100 | #249 | Tragic $37,904 |
| Immigrants | Iraq | 2.2 /100 | #250 | Tragic $37,864 |
| Welsh | 2.1 /100 | #251 | Tragic $37,856 |
| Immigrants | Dominica | 2.0 /100 | #252 | Tragic $37,825 |
| Danes | 1.6 /100 | #253 | Tragic $37,730 |
| Whites/Caucasians | 1.1 /100 | #254 | Tragic $37,531 |
| Colville | 1.1 /100 | #255 | Tragic $37,514 |