Inupiat vs Tsimshian Median Female Earnings
COMPARE
Inupiat
Tsimshian
Median Female Earnings
Median Female Earnings Comparison
Inupiat
Tsimshian
$40,080
MEDIAN FEMALE EARNINGS
68.9/ 100
METRIC RATING
160th/ 347
METRIC RANK
$39,530
MEDIAN FEMALE EARNINGS
41.4/ 100
METRIC RATING
181st/ 347
METRIC RANK
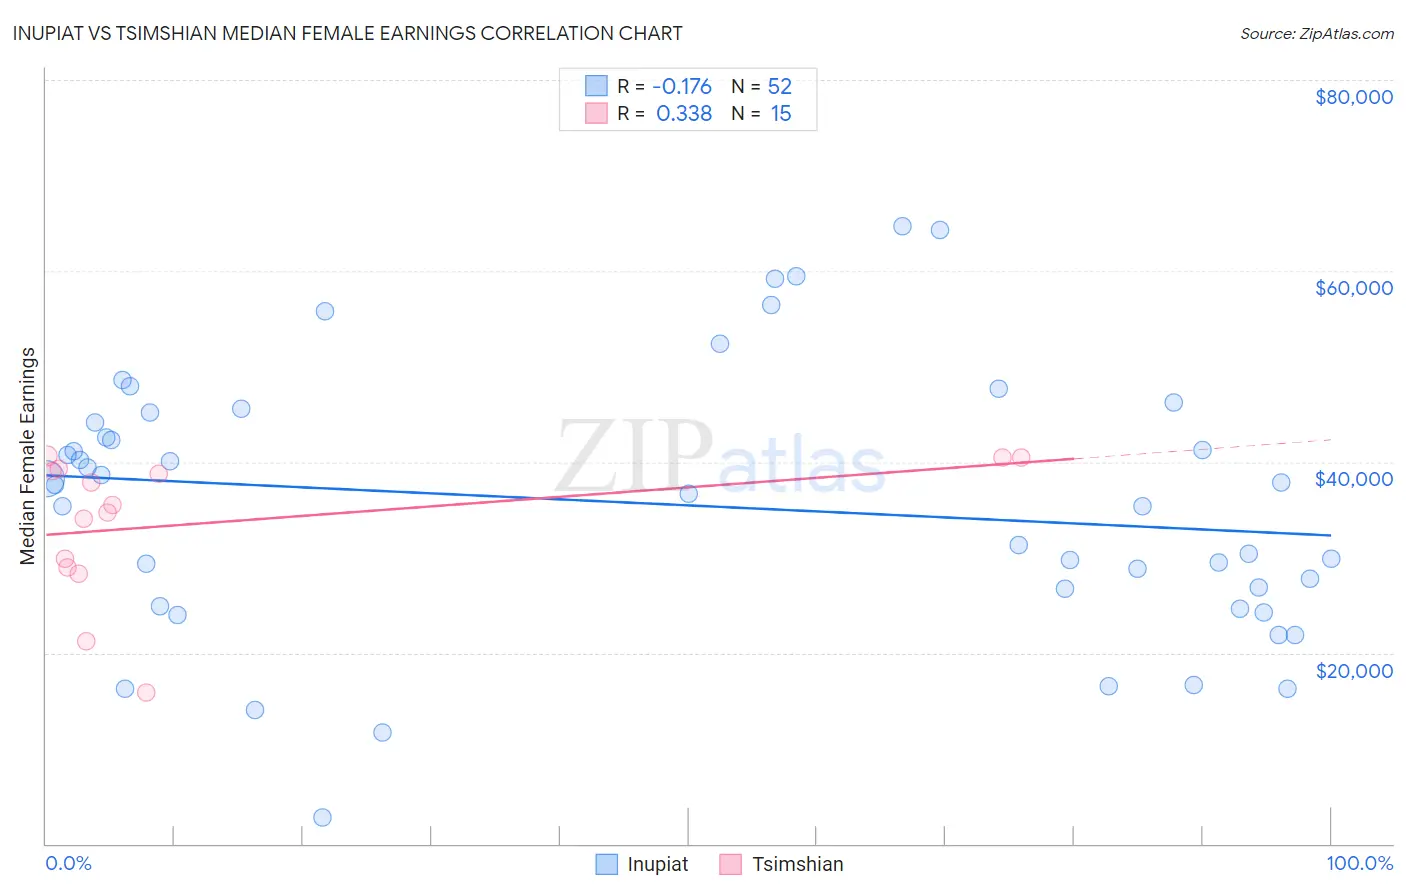
Inupiat vs Tsimshian Median Female Earnings Correlation Chart
The statistical analysis conducted on geographies consisting of 96,311,190 people shows a poor negative correlation between the proportion of Inupiat and median female earnings in the United States with a correlation coefficient (R) of -0.176 and weighted average of $40,080. Similarly, the statistical analysis conducted on geographies consisting of 15,624,755 people shows a mild positive correlation between the proportion of Tsimshian and median female earnings in the United States with a correlation coefficient (R) of 0.338 and weighted average of $39,530, a difference of 1.4%.
Median Female Earnings Correlation Summary
| Measurement | Inupiat | Tsimshian |
| Minimum | $2,800 | $15,833 |
| Maximum | $64,688 | $40,588 |
| Range | $61,888 | $24,755 |
| Mean | $35,589 | $33,643 |
| Median | $37,155 | $35,500 |
| Interquartile 25% (IQ1) | $25,800 | $28,977 |
| Interquartile 75% (IQ3) | $44,695 | $39,276 |
| Interquartile Range (IQR) | $18,895 | $10,299 |
| Standard Deviation (Sample) | $13,962 | $7,485 |
| Standard Deviation (Population) | $13,827 | $7,232 |
Similar Demographics by Median Female Earnings
Demographics Similar to Inupiat by Median Female Earnings
In terms of median female earnings, the demographic groups most similar to Inupiat are Alsatian ($40,060, a difference of 0.050%), South American Indian ($40,019, a difference of 0.15%), Immigrants from Vietnam ($40,153, a difference of 0.18%), Lebanese ($40,006, a difference of 0.18%), and Immigrants from Senegal ($40,157, a difference of 0.19%).
| Demographics | Rating | Rank | Median Female Earnings |
| British West Indians | 77.7 /100 | #153 | Good $40,299 |
| Immigrants | Oceania | 77.6 /100 | #154 | Good $40,297 |
| Immigrants | Africa | 76.2 /100 | #155 | Good $40,257 |
| Peruvians | 75.3 /100 | #156 | Good $40,234 |
| Portuguese | 73.0 /100 | #157 | Good $40,177 |
| Immigrants | Senegal | 72.2 /100 | #158 | Good $40,157 |
| Immigrants | Vietnam | 72.0 /100 | #159 | Good $40,153 |
| Inupiat | 68.9 /100 | #160 | Good $40,080 |
| Alsatians | 68.0 /100 | #161 | Good $40,060 |
| South American Indians | 66.1 /100 | #162 | Good $40,019 |
| Lebanese | 65.5 /100 | #163 | Good $40,006 |
| Immigrants | Saudi Arabia | 62.9 /100 | #164 | Good $39,952 |
| Immigrants | Bangladesh | 60.8 /100 | #165 | Good $39,910 |
| Immigrants | Ghana | 60.0 /100 | #166 | Good $39,894 |
| Luxembourgers | 59.9 /100 | #167 | Average $39,891 |
Demographics Similar to Tsimshian by Median Female Earnings
In terms of median female earnings, the demographic groups most similar to Tsimshian are Immigrants from Kenya ($39,535, a difference of 0.010%), Tlingit-Haida ($39,513, a difference of 0.050%), Hungarian ($39,510, a difference of 0.050%), Immigrants from Germany ($39,603, a difference of 0.18%), and European ($39,457, a difference of 0.19%).
| Demographics | Rating | Rank | Median Female Earnings |
| South Americans | 50.0 /100 | #174 | Average $39,698 |
| Immigrants | South America | 47.2 /100 | #175 | Average $39,643 |
| Nigerians | 47.0 /100 | #176 | Average $39,641 |
| Costa Ricans | 46.1 /100 | #177 | Average $39,622 |
| Slavs | 45.6 /100 | #178 | Average $39,613 |
| Immigrants | Germany | 45.1 /100 | #179 | Average $39,603 |
| Immigrants | Kenya | 41.6 /100 | #180 | Average $39,535 |
| Tsimshian | 41.4 /100 | #181 | Average $39,530 |
| Tlingit-Haida | 40.5 /100 | #182 | Average $39,513 |
| Hungarians | 40.3 /100 | #183 | Average $39,510 |
| Europeans | 37.7 /100 | #184 | Fair $39,457 |
| Immigrants | West Indies | 36.9 /100 | #185 | Fair $39,441 |
| Colombians | 36.9 /100 | #186 | Fair $39,439 |
| Swedes | 36.0 /100 | #187 | Fair $39,421 |
| Bermudans | 35.9 /100 | #188 | Fair $39,418 |