Inupiat vs Immigrants from China Median Female Earnings
COMPARE
Inupiat
Immigrants from China
Median Female Earnings
Median Female Earnings Comparison
Inupiat
Immigrants from China
$40,080
MEDIAN FEMALE EARNINGS
68.9/ 100
METRIC RATING
160th/ 347
METRIC RANK
$46,972
MEDIAN FEMALE EARNINGS
100.0/ 100
METRIC RATING
10th/ 347
METRIC RANK
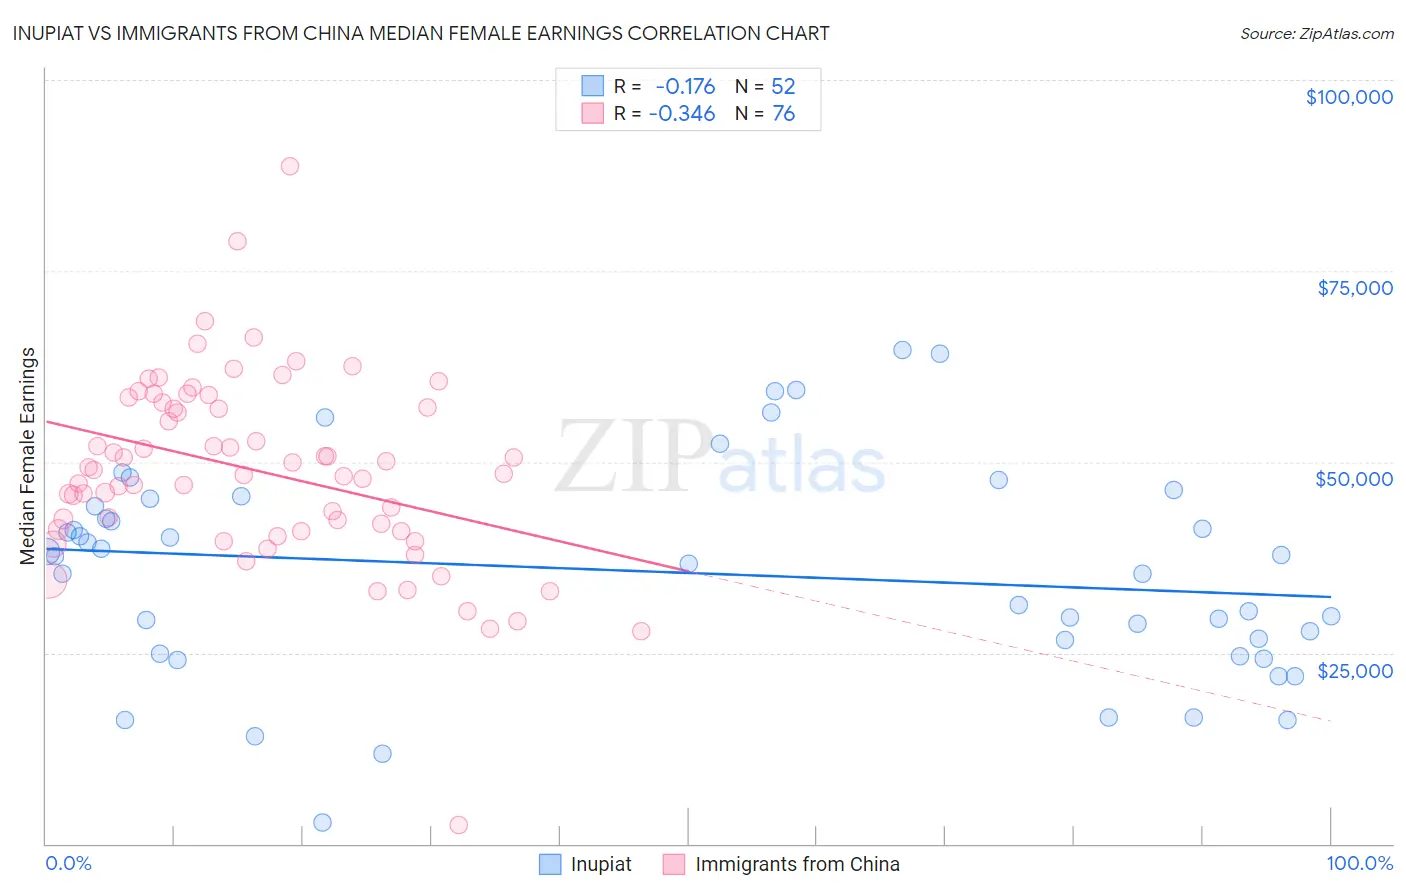
Inupiat vs Immigrants from China Median Female Earnings Correlation Chart
The statistical analysis conducted on geographies consisting of 96,311,190 people shows a poor negative correlation between the proportion of Inupiat and median female earnings in the United States with a correlation coefficient (R) of -0.176 and weighted average of $40,080. Similarly, the statistical analysis conducted on geographies consisting of 456,866,400 people shows a mild negative correlation between the proportion of Immigrants from China and median female earnings in the United States with a correlation coefficient (R) of -0.346 and weighted average of $46,972, a difference of 17.2%.
Median Female Earnings Correlation Summary
| Measurement | Inupiat | Immigrants from China |
| Minimum | $2,800 | $2,499 |
| Maximum | $64,688 | $88,690 |
| Range | $61,888 | $86,191 |
| Mean | $35,589 | $48,809 |
| Median | $37,155 | $48,719 |
| Interquartile 25% (IQ1) | $25,800 | $41,024 |
| Interquartile 75% (IQ3) | $44,695 | $57,452 |
| Interquartile Range (IQR) | $18,895 | $16,427 |
| Standard Deviation (Sample) | $13,962 | $12,504 |
| Standard Deviation (Population) | $13,827 | $12,421 |
Similar Demographics by Median Female Earnings
Demographics Similar to Inupiat by Median Female Earnings
In terms of median female earnings, the demographic groups most similar to Inupiat are Alsatian ($40,060, a difference of 0.050%), South American Indian ($40,019, a difference of 0.15%), Immigrants from Vietnam ($40,153, a difference of 0.18%), Lebanese ($40,006, a difference of 0.18%), and Immigrants from Senegal ($40,157, a difference of 0.19%).
| Demographics | Rating | Rank | Median Female Earnings |
| British West Indians | 77.7 /100 | #153 | Good $40,299 |
| Immigrants | Oceania | 77.6 /100 | #154 | Good $40,297 |
| Immigrants | Africa | 76.2 /100 | #155 | Good $40,257 |
| Peruvians | 75.3 /100 | #156 | Good $40,234 |
| Portuguese | 73.0 /100 | #157 | Good $40,177 |
| Immigrants | Senegal | 72.2 /100 | #158 | Good $40,157 |
| Immigrants | Vietnam | 72.0 /100 | #159 | Good $40,153 |
| Inupiat | 68.9 /100 | #160 | Good $40,080 |
| Alsatians | 68.0 /100 | #161 | Good $40,060 |
| South American Indians | 66.1 /100 | #162 | Good $40,019 |
| Lebanese | 65.5 /100 | #163 | Good $40,006 |
| Immigrants | Saudi Arabia | 62.9 /100 | #164 | Good $39,952 |
| Immigrants | Bangladesh | 60.8 /100 | #165 | Good $39,910 |
| Immigrants | Ghana | 60.0 /100 | #166 | Good $39,894 |
| Luxembourgers | 59.9 /100 | #167 | Average $39,891 |
Demographics Similar to Immigrants from China by Median Female Earnings
In terms of median female earnings, the demographic groups most similar to Immigrants from China are Okinawan ($46,905, a difference of 0.14%), Immigrants from Israel ($46,902, a difference of 0.15%), Immigrants from Iran ($47,154, a difference of 0.39%), Immigrants from Australia ($46,573, a difference of 0.86%), and Soviet Union ($46,556, a difference of 0.89%).
| Demographics | Rating | Rank | Median Female Earnings |
| Immigrants | Taiwan | 100.0 /100 | #3 | Exceptional $49,256 |
| Immigrants | India | 100.0 /100 | #4 | Exceptional $48,292 |
| Immigrants | Singapore | 100.0 /100 | #5 | Exceptional $47,986 |
| Immigrants | Ireland | 100.0 /100 | #6 | Exceptional $47,598 |
| Thais | 100.0 /100 | #7 | Exceptional $47,577 |
| Iranians | 100.0 /100 | #8 | Exceptional $47,421 |
| Immigrants | Iran | 100.0 /100 | #9 | Exceptional $47,154 |
| Immigrants | China | 100.0 /100 | #10 | Exceptional $46,972 |
| Okinawans | 100.0 /100 | #11 | Exceptional $46,905 |
| Immigrants | Israel | 100.0 /100 | #12 | Exceptional $46,902 |
| Immigrants | Australia | 100.0 /100 | #13 | Exceptional $46,573 |
| Soviet Union | 100.0 /100 | #14 | Exceptional $46,556 |
| Immigrants | Eastern Asia | 100.0 /100 | #15 | Exceptional $46,502 |
| Indians (Asian) | 100.0 /100 | #16 | Exceptional $46,481 |
| Immigrants | South Central Asia | 100.0 /100 | #17 | Exceptional $46,324 |