Inupiat vs Iraqi Median Female Earnings
COMPARE
Inupiat
Iraqi
Median Female Earnings
Median Female Earnings Comparison
Inupiat
Iraqis
$40,080
MEDIAN FEMALE EARNINGS
68.9/ 100
METRIC RATING
160th/ 347
METRIC RANK
$38,666
MEDIAN FEMALE EARNINGS
10.5/ 100
METRIC RATING
214th/ 347
METRIC RANK
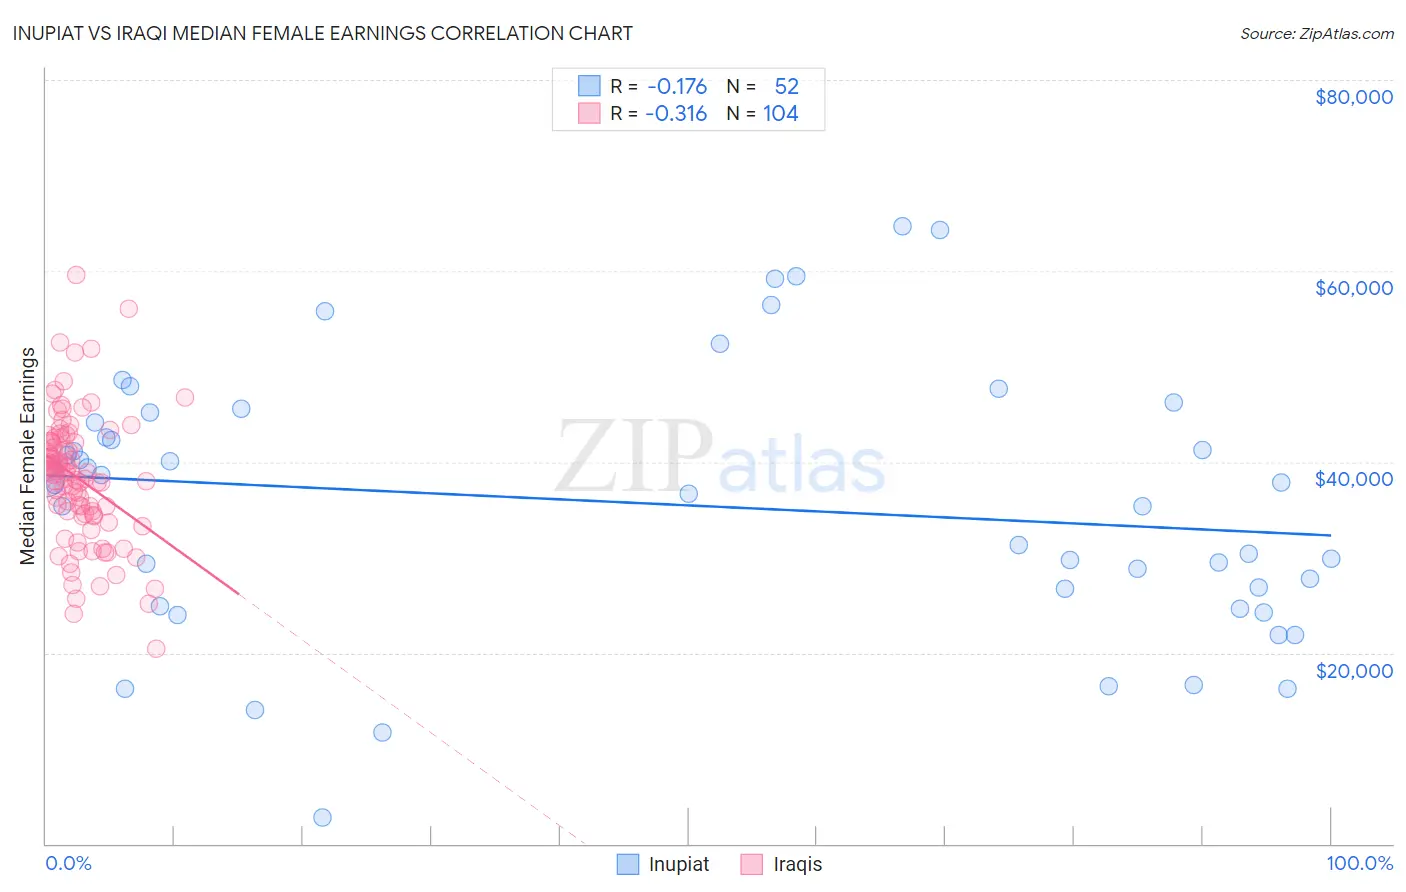
Inupiat vs Iraqi Median Female Earnings Correlation Chart
The statistical analysis conducted on geographies consisting of 96,311,190 people shows a poor negative correlation between the proportion of Inupiat and median female earnings in the United States with a correlation coefficient (R) of -0.176 and weighted average of $40,080. Similarly, the statistical analysis conducted on geographies consisting of 170,627,853 people shows a mild negative correlation between the proportion of Iraqis and median female earnings in the United States with a correlation coefficient (R) of -0.316 and weighted average of $38,666, a difference of 3.7%.
Median Female Earnings Correlation Summary
| Measurement | Inupiat | Iraqi |
| Minimum | $2,800 | $20,406 |
| Maximum | $64,688 | $59,566 |
| Range | $61,888 | $39,160 |
| Mean | $35,589 | $38,287 |
| Median | $37,155 | $38,841 |
| Interquartile 25% (IQ1) | $25,800 | $34,526 |
| Interquartile 75% (IQ3) | $44,695 | $42,153 |
| Interquartile Range (IQR) | $18,895 | $7,626 |
| Standard Deviation (Sample) | $13,962 | $6,723 |
| Standard Deviation (Population) | $13,827 | $6,691 |
Similar Demographics by Median Female Earnings
Demographics Similar to Inupiat by Median Female Earnings
In terms of median female earnings, the demographic groups most similar to Inupiat are Alsatian ($40,060, a difference of 0.050%), South American Indian ($40,019, a difference of 0.15%), Immigrants from Vietnam ($40,153, a difference of 0.18%), Lebanese ($40,006, a difference of 0.18%), and Immigrants from Senegal ($40,157, a difference of 0.19%).
| Demographics | Rating | Rank | Median Female Earnings |
| British West Indians | 77.7 /100 | #153 | Good $40,299 |
| Immigrants | Oceania | 77.6 /100 | #154 | Good $40,297 |
| Immigrants | Africa | 76.2 /100 | #155 | Good $40,257 |
| Peruvians | 75.3 /100 | #156 | Good $40,234 |
| Portuguese | 73.0 /100 | #157 | Good $40,177 |
| Immigrants | Senegal | 72.2 /100 | #158 | Good $40,157 |
| Immigrants | Vietnam | 72.0 /100 | #159 | Good $40,153 |
| Inupiat | 68.9 /100 | #160 | Good $40,080 |
| Alsatians | 68.0 /100 | #161 | Good $40,060 |
| South American Indians | 66.1 /100 | #162 | Good $40,019 |
| Lebanese | 65.5 /100 | #163 | Good $40,006 |
| Immigrants | Saudi Arabia | 62.9 /100 | #164 | Good $39,952 |
| Immigrants | Bangladesh | 60.8 /100 | #165 | Good $39,910 |
| Immigrants | Ghana | 60.0 /100 | #166 | Good $39,894 |
| Luxembourgers | 59.9 /100 | #167 | Average $39,891 |
Demographics Similar to Iraqis by Median Female Earnings
In terms of median female earnings, the demographic groups most similar to Iraqis are Jamaican ($38,670, a difference of 0.010%), Spaniard ($38,656, a difference of 0.020%), Immigrants from Ecuador ($38,644, a difference of 0.060%), Immigrants from Jamaica ($38,625, a difference of 0.11%), and Guamanian/Chamorro ($38,717, a difference of 0.13%).
| Demographics | Rating | Rank | Median Female Earnings |
| Immigrants | Cambodia | 14.2 /100 | #207 | Poor $38,833 |
| Immigrants | Thailand | 13.6 /100 | #208 | Poor $38,810 |
| Norwegians | 13.4 /100 | #209 | Poor $38,802 |
| Czechoslovakians | 12.0 /100 | #210 | Poor $38,738 |
| Aleuts | 11.6 /100 | #211 | Poor $38,719 |
| Guamanians/Chamorros | 11.5 /100 | #212 | Poor $38,717 |
| Jamaicans | 10.5 /100 | #213 | Poor $38,670 |
| Iraqis | 10.5 /100 | #214 | Poor $38,666 |
| Spaniards | 10.3 /100 | #215 | Poor $38,656 |
| Immigrants | Ecuador | 10.1 /100 | #216 | Poor $38,644 |
| Immigrants | Jamaica | 9.7 /100 | #217 | Tragic $38,625 |
| Cape Verdeans | 9.5 /100 | #218 | Tragic $38,614 |
| Nepalese | 9.3 /100 | #219 | Tragic $38,603 |
| Yugoslavians | 8.8 /100 | #220 | Tragic $38,573 |
| Immigrants | Azores | 8.8 /100 | #221 | Tragic $38,573 |