Yuman vs Tsimshian Median Female Earnings
COMPARE
Yuman
Tsimshian
Median Female Earnings
Median Female Earnings Comparison
Yuman
Tsimshian
$35,377
MEDIAN FEMALE EARNINGS
0.0/ 100
METRIC RATING
300th/ 347
METRIC RANK
$39,530
MEDIAN FEMALE EARNINGS
41.4/ 100
METRIC RATING
181st/ 347
METRIC RANK
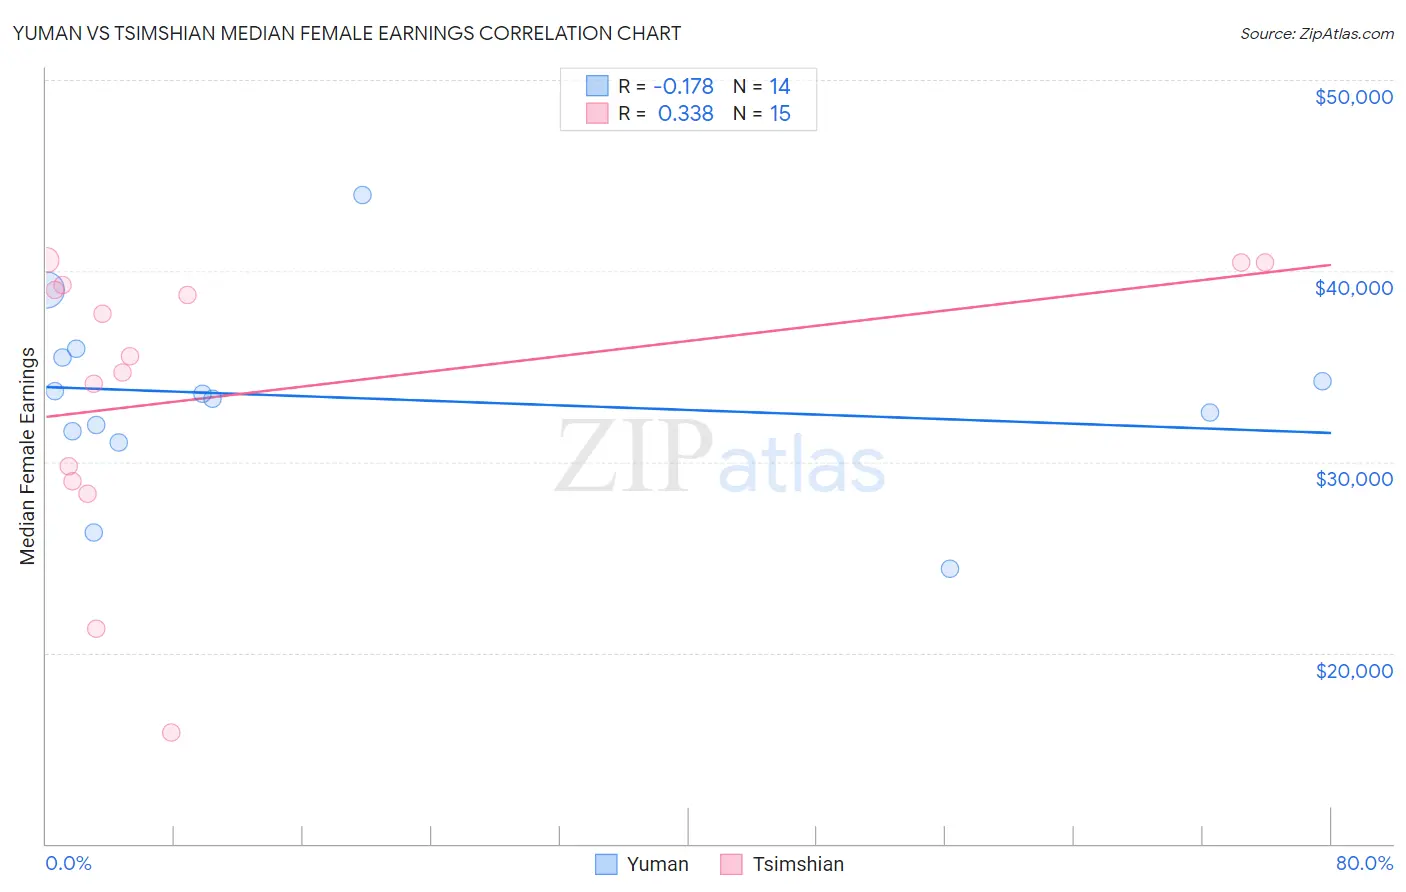
Yuman vs Tsimshian Median Female Earnings Correlation Chart
The statistical analysis conducted on geographies consisting of 40,678,701 people shows a poor negative correlation between the proportion of Yuman and median female earnings in the United States with a correlation coefficient (R) of -0.178 and weighted average of $35,377. Similarly, the statistical analysis conducted on geographies consisting of 15,624,755 people shows a mild positive correlation between the proportion of Tsimshian and median female earnings in the United States with a correlation coefficient (R) of 0.338 and weighted average of $39,530, a difference of 11.7%.
Median Female Earnings Correlation Summary
| Measurement | Yuman | Tsimshian |
| Minimum | $24,415 | $15,833 |
| Maximum | $43,952 | $40,588 |
| Range | $19,537 | $24,755 |
| Mean | $33,355 | $33,643 |
| Median | $33,435 | $35,500 |
| Interquartile 25% (IQ1) | $31,604 | $28,977 |
| Interquartile 75% (IQ3) | $35,454 | $39,276 |
| Interquartile Range (IQR) | $3,850 | $10,299 |
| Standard Deviation (Sample) | $4,771 | $7,485 |
| Standard Deviation (Population) | $4,598 | $7,232 |
Similar Demographics by Median Female Earnings
Demographics Similar to Yuman by Median Female Earnings
In terms of median female earnings, the demographic groups most similar to Yuman are Pima ($35,326, a difference of 0.14%), Black/African American ($35,315, a difference of 0.18%), Immigrants from Guatemala ($35,444, a difference of 0.19%), Immigrants from Latin America ($35,307, a difference of 0.20%), and Immigrants from Micronesia ($35,477, a difference of 0.28%).
| Demographics | Rating | Rank | Median Female Earnings |
| Guatemalans | 0.0 /100 | #293 | Tragic $35,695 |
| Cheyenne | 0.0 /100 | #294 | Tragic $35,673 |
| Comanche | 0.0 /100 | #295 | Tragic $35,661 |
| Mexican American Indians | 0.0 /100 | #296 | Tragic $35,629 |
| Hmong | 0.0 /100 | #297 | Tragic $35,498 |
| Immigrants | Micronesia | 0.0 /100 | #298 | Tragic $35,477 |
| Immigrants | Guatemala | 0.0 /100 | #299 | Tragic $35,444 |
| Yuman | 0.0 /100 | #300 | Tragic $35,377 |
| Pima | 0.0 /100 | #301 | Tragic $35,326 |
| Blacks/African Americans | 0.0 /100 | #302 | Tragic $35,315 |
| Immigrants | Latin America | 0.0 /100 | #303 | Tragic $35,307 |
| Crow | 0.0 /100 | #304 | Tragic $35,266 |
| Bahamians | 0.0 /100 | #305 | Tragic $35,125 |
| Fijians | 0.0 /100 | #306 | Tragic $35,114 |
| Sioux | 0.0 /100 | #307 | Tragic $35,063 |
Demographics Similar to Tsimshian by Median Female Earnings
In terms of median female earnings, the demographic groups most similar to Tsimshian are Immigrants from Kenya ($39,535, a difference of 0.010%), Tlingit-Haida ($39,513, a difference of 0.050%), Hungarian ($39,510, a difference of 0.050%), Immigrants from Germany ($39,603, a difference of 0.18%), and European ($39,457, a difference of 0.19%).
| Demographics | Rating | Rank | Median Female Earnings |
| South Americans | 50.0 /100 | #174 | Average $39,698 |
| Immigrants | South America | 47.2 /100 | #175 | Average $39,643 |
| Nigerians | 47.0 /100 | #176 | Average $39,641 |
| Costa Ricans | 46.1 /100 | #177 | Average $39,622 |
| Slavs | 45.6 /100 | #178 | Average $39,613 |
| Immigrants | Germany | 45.1 /100 | #179 | Average $39,603 |
| Immigrants | Kenya | 41.6 /100 | #180 | Average $39,535 |
| Tsimshian | 41.4 /100 | #181 | Average $39,530 |
| Tlingit-Haida | 40.5 /100 | #182 | Average $39,513 |
| Hungarians | 40.3 /100 | #183 | Average $39,510 |
| Europeans | 37.7 /100 | #184 | Fair $39,457 |
| Immigrants | West Indies | 36.9 /100 | #185 | Fair $39,441 |
| Colombians | 36.9 /100 | #186 | Fair $39,439 |
| Swedes | 36.0 /100 | #187 | Fair $39,421 |
| Bermudans | 35.9 /100 | #188 | Fair $39,418 |