Malaysian vs Immigrants from China Median Female Earnings
COMPARE
Malaysian
Immigrants from China
Median Female Earnings
Median Female Earnings Comparison
Malaysians
Immigrants from China
$37,298
MEDIAN FEMALE EARNINGS
0.7/ 100
METRIC RATING
261st/ 347
METRIC RANK
$46,972
MEDIAN FEMALE EARNINGS
100.0/ 100
METRIC RATING
10th/ 347
METRIC RANK
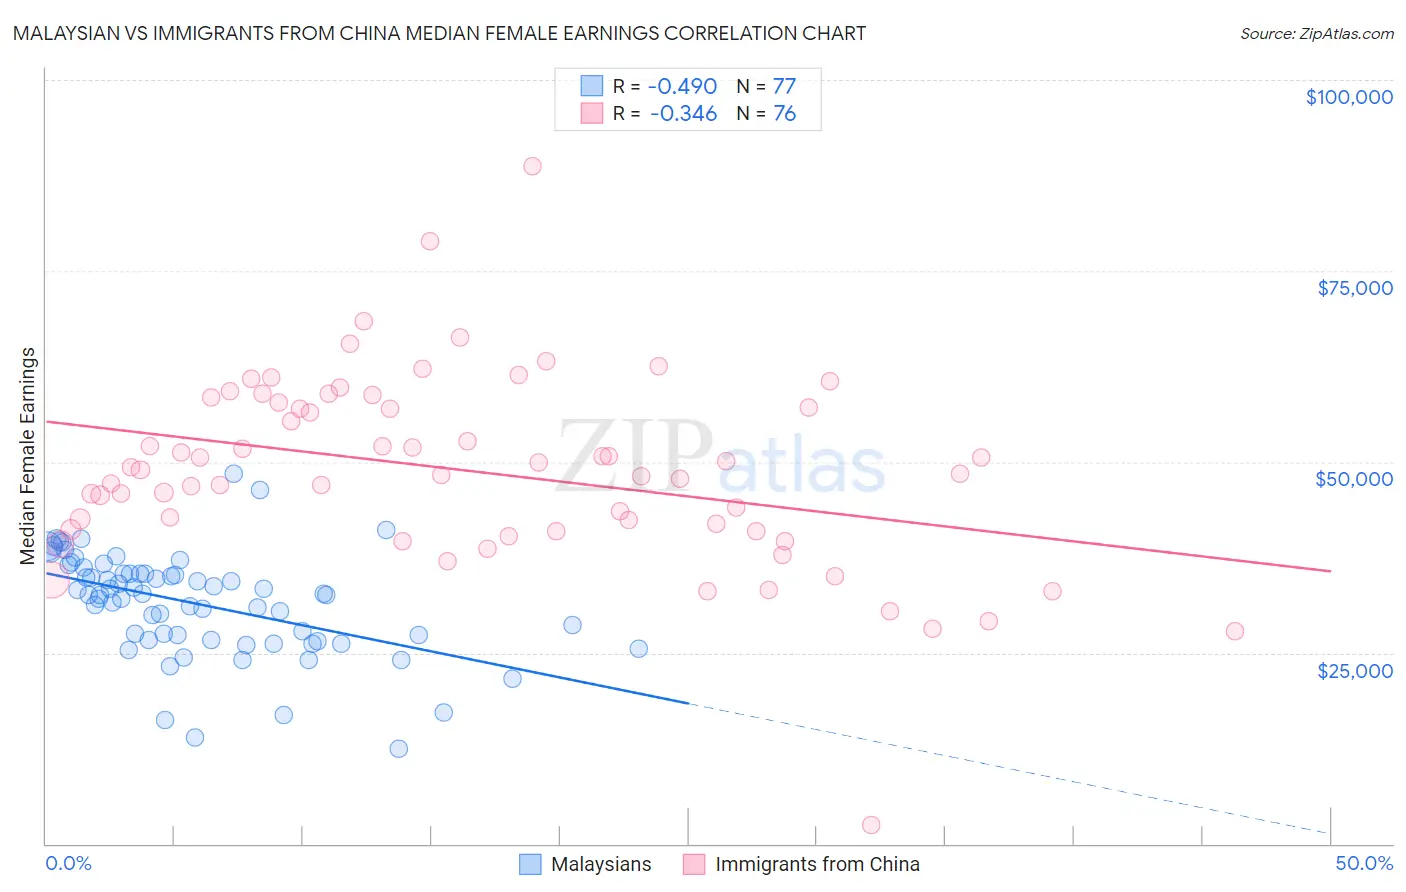
Malaysian vs Immigrants from China Median Female Earnings Correlation Chart
The statistical analysis conducted on geographies consisting of 226,078,777 people shows a moderate negative correlation between the proportion of Malaysians and median female earnings in the United States with a correlation coefficient (R) of -0.490 and weighted average of $37,298. Similarly, the statistical analysis conducted on geographies consisting of 456,866,400 people shows a mild negative correlation between the proportion of Immigrants from China and median female earnings in the United States with a correlation coefficient (R) of -0.346 and weighted average of $46,972, a difference of 25.9%.
Median Female Earnings Correlation Summary
| Measurement | Malaysian | Immigrants from China |
| Minimum | $12,451 | $2,499 |
| Maximum | $48,393 | $88,690 |
| Range | $35,942 | $86,191 |
| Mean | $31,448 | $48,809 |
| Median | $32,647 | $48,719 |
| Interquartile 25% (IQ1) | $26,696 | $41,024 |
| Interquartile 75% (IQ3) | $35,386 | $57,452 |
| Interquartile Range (IQR) | $8,690 | $16,427 |
| Standard Deviation (Sample) | $6,791 | $12,504 |
| Standard Deviation (Population) | $6,747 | $12,421 |
Similar Demographics by Median Female Earnings
Demographics Similar to Malaysians by Median Female Earnings
In terms of median female earnings, the demographic groups most similar to Malaysians are Venezuelan ($37,282, a difference of 0.040%), Dutch ($37,339, a difference of 0.11%), Scotch-Irish ($37,383, a difference of 0.23%), Belizean ($37,429, a difference of 0.35%), and German Russian ($37,105, a difference of 0.52%).
| Demographics | Rating | Rank | Median Female Earnings |
| Whites/Caucasians | 1.1 /100 | #254 | Tragic $37,531 |
| Colville | 1.1 /100 | #255 | Tragic $37,514 |
| Samoans | 1.0 /100 | #256 | Tragic $37,498 |
| Hawaiians | 1.0 /100 | #257 | Tragic $37,497 |
| Belizeans | 0.9 /100 | #258 | Tragic $37,429 |
| Scotch-Irish | 0.8 /100 | #259 | Tragic $37,383 |
| Dutch | 0.7 /100 | #260 | Tragic $37,339 |
| Malaysians | 0.7 /100 | #261 | Tragic $37,298 |
| Venezuelans | 0.7 /100 | #262 | Tragic $37,282 |
| German Russians | 0.5 /100 | #263 | Tragic $37,105 |
| Salvadorans | 0.4 /100 | #264 | Tragic $37,083 |
| Immigrants | Belize | 0.4 /100 | #265 | Tragic $37,056 |
| Dominicans | 0.4 /100 | #266 | Tragic $37,046 |
| Immigrants | Nonimmigrants | 0.4 /100 | #267 | Tragic $37,024 |
| Cree | 0.4 /100 | #268 | Tragic $37,018 |
Demographics Similar to Immigrants from China by Median Female Earnings
In terms of median female earnings, the demographic groups most similar to Immigrants from China are Okinawan ($46,905, a difference of 0.14%), Immigrants from Israel ($46,902, a difference of 0.15%), Immigrants from Iran ($47,154, a difference of 0.39%), Immigrants from Australia ($46,573, a difference of 0.86%), and Soviet Union ($46,556, a difference of 0.89%).
| Demographics | Rating | Rank | Median Female Earnings |
| Immigrants | Taiwan | 100.0 /100 | #3 | Exceptional $49,256 |
| Immigrants | India | 100.0 /100 | #4 | Exceptional $48,292 |
| Immigrants | Singapore | 100.0 /100 | #5 | Exceptional $47,986 |
| Immigrants | Ireland | 100.0 /100 | #6 | Exceptional $47,598 |
| Thais | 100.0 /100 | #7 | Exceptional $47,577 |
| Iranians | 100.0 /100 | #8 | Exceptional $47,421 |
| Immigrants | Iran | 100.0 /100 | #9 | Exceptional $47,154 |
| Immigrants | China | 100.0 /100 | #10 | Exceptional $46,972 |
| Okinawans | 100.0 /100 | #11 | Exceptional $46,905 |
| Immigrants | Israel | 100.0 /100 | #12 | Exceptional $46,902 |
| Immigrants | Australia | 100.0 /100 | #13 | Exceptional $46,573 |
| Soviet Union | 100.0 /100 | #14 | Exceptional $46,556 |
| Immigrants | Eastern Asia | 100.0 /100 | #15 | Exceptional $46,502 |
| Indians (Asian) | 100.0 /100 | #16 | Exceptional $46,481 |
| Immigrants | South Central Asia | 100.0 /100 | #17 | Exceptional $46,324 |