Bhutanese vs Immigrants from Albania Median Family Income
COMPARE
Bhutanese
Immigrants from Albania
Median Family Income
Median Family Income Comparison
Bhutanese
Immigrants from Albania
$119,800
MEDIAN FAMILY INCOME
100.0/ 100
METRIC RATING
33rd/ 347
METRIC RANK
$105,285
MEDIAN FAMILY INCOME
79.1/ 100
METRIC RATING
152nd/ 347
METRIC RANK
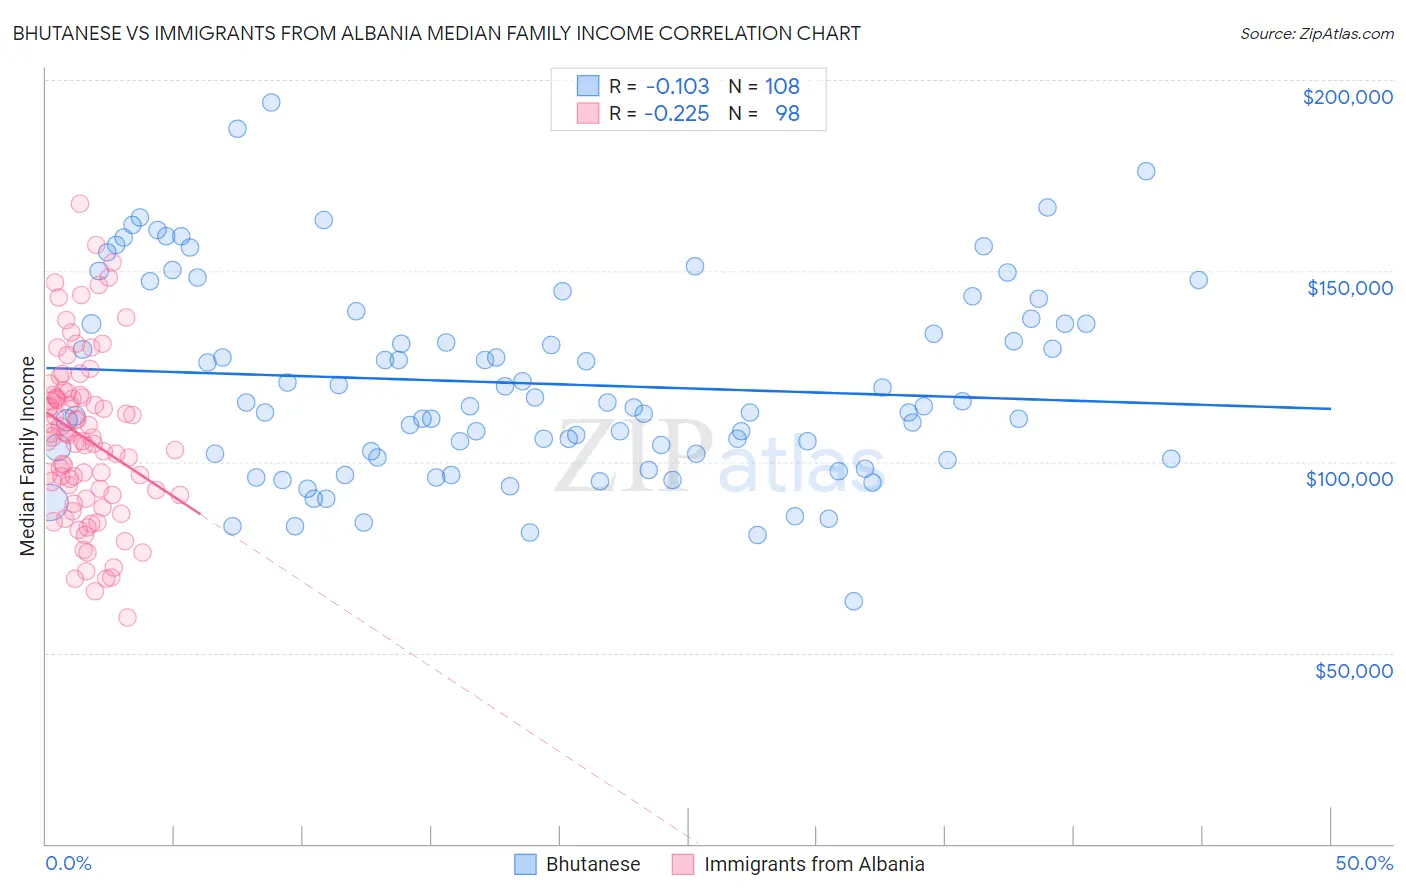
Bhutanese vs Immigrants from Albania Median Family Income Correlation Chart
The statistical analysis conducted on geographies consisting of 454,953,353 people shows a poor negative correlation between the proportion of Bhutanese and median family income in the United States with a correlation coefficient (R) of -0.103 and weighted average of $119,800. Similarly, the statistical analysis conducted on geographies consisting of 119,337,318 people shows a weak negative correlation between the proportion of Immigrants from Albania and median family income in the United States with a correlation coefficient (R) of -0.225 and weighted average of $105,285, a difference of 13.8%.
Median Family Income Correlation Summary
| Measurement | Bhutanese | Immigrants from Albania |
| Minimum | $63,382 | $59,250 |
| Maximum | $194,165 | $167,526 |
| Range | $130,783 | $108,276 |
| Mean | $120,532 | $106,367 |
| Median | $114,614 | $106,522 |
| Interquartile 25% (IQ1) | $101,662 | $91,250 |
| Interquartile 75% (IQ3) | $136,845 | $117,507 |
| Interquartile Range (IQR) | $35,183 | $26,257 |
| Standard Deviation (Sample) | $25,704 | $21,718 |
| Standard Deviation (Population) | $25,585 | $21,607 |
Similar Demographics by Median Family Income
Demographics Similar to Bhutanese by Median Family Income
In terms of median family income, the demographic groups most similar to Bhutanese are Asian ($119,955, a difference of 0.13%), Immigrants from France ($120,076, a difference of 0.23%), Bolivian ($119,479, a difference of 0.27%), Immigrants from Sri Lanka ($120,263, a difference of 0.39%), and Latvian ($120,301, a difference of 0.42%).
| Demographics | Rating | Rank | Median Family Income |
| Immigrants | Switzerland | 100.0 /100 | #26 | Exceptional $120,726 |
| Russians | 100.0 /100 | #27 | Exceptional $120,487 |
| Immigrants | Denmark | 100.0 /100 | #28 | Exceptional $120,445 |
| Latvians | 100.0 /100 | #29 | Exceptional $120,301 |
| Immigrants | Sri Lanka | 100.0 /100 | #30 | Exceptional $120,263 |
| Immigrants | France | 100.0 /100 | #31 | Exceptional $120,076 |
| Asians | 100.0 /100 | #32 | Exceptional $119,955 |
| Bhutanese | 100.0 /100 | #33 | Exceptional $119,800 |
| Bolivians | 100.0 /100 | #34 | Exceptional $119,479 |
| Soviet Union | 100.0 /100 | #35 | Exceptional $119,262 |
| Israelis | 100.0 /100 | #36 | Exceptional $118,577 |
| Australians | 100.0 /100 | #37 | Exceptional $118,440 |
| Immigrants | Turkey | 100.0 /100 | #38 | Exceptional $118,325 |
| Immigrants | Asia | 100.0 /100 | #39 | Exceptional $118,291 |
| Immigrants | Lithuania | 100.0 /100 | #40 | Exceptional $118,053 |
Demographics Similar to Immigrants from Albania by Median Family Income
In terms of median family income, the demographic groups most similar to Immigrants from Albania are Slavic ($105,144, a difference of 0.13%), Peruvian ($105,444, a difference of 0.15%), Irish ($105,453, a difference of 0.16%), Immigrants from Germany ($105,507, a difference of 0.21%), and Immigrants from Nepal ($104,966, a difference of 0.30%).
| Demographics | Rating | Rank | Median Family Income |
| Danes | 83.8 /100 | #145 | Excellent $105,900 |
| Czechs | 83.4 /100 | #146 | Excellent $105,839 |
| Immigrants | Chile | 82.1 /100 | #147 | Excellent $105,655 |
| Hungarians | 81.7 /100 | #148 | Excellent $105,609 |
| Immigrants | Germany | 80.9 /100 | #149 | Excellent $105,507 |
| Irish | 80.5 /100 | #150 | Excellent $105,453 |
| Peruvians | 80.4 /100 | #151 | Excellent $105,444 |
| Immigrants | Albania | 79.1 /100 | #152 | Good $105,285 |
| Slavs | 77.9 /100 | #153 | Good $105,144 |
| Immigrants | Nepal | 76.3 /100 | #154 | Good $104,966 |
| Native Hawaiians | 75.8 /100 | #155 | Good $104,910 |
| Basques | 74.4 /100 | #156 | Good $104,760 |
| Moroccans | 71.6 /100 | #157 | Good $104,488 |
| Scandinavians | 70.8 /100 | #158 | Good $104,410 |
| Swiss | 70.7 /100 | #159 | Good $104,396 |