Immigrants from Northern Europe vs Ethiopian Median Male Earnings
COMPARE
Immigrants from Northern Europe
Ethiopian
Median Male Earnings
Median Male Earnings Comparison
Immigrants from Northern Europe
Ethiopians
$64,987
MEDIAN MALE EARNINGS
100.0/ 100
METRIC RATING
24th/ 347
METRIC RANK
$56,243
MEDIAN MALE EARNINGS
84.8/ 100
METRIC RATING
142nd/ 347
METRIC RANK
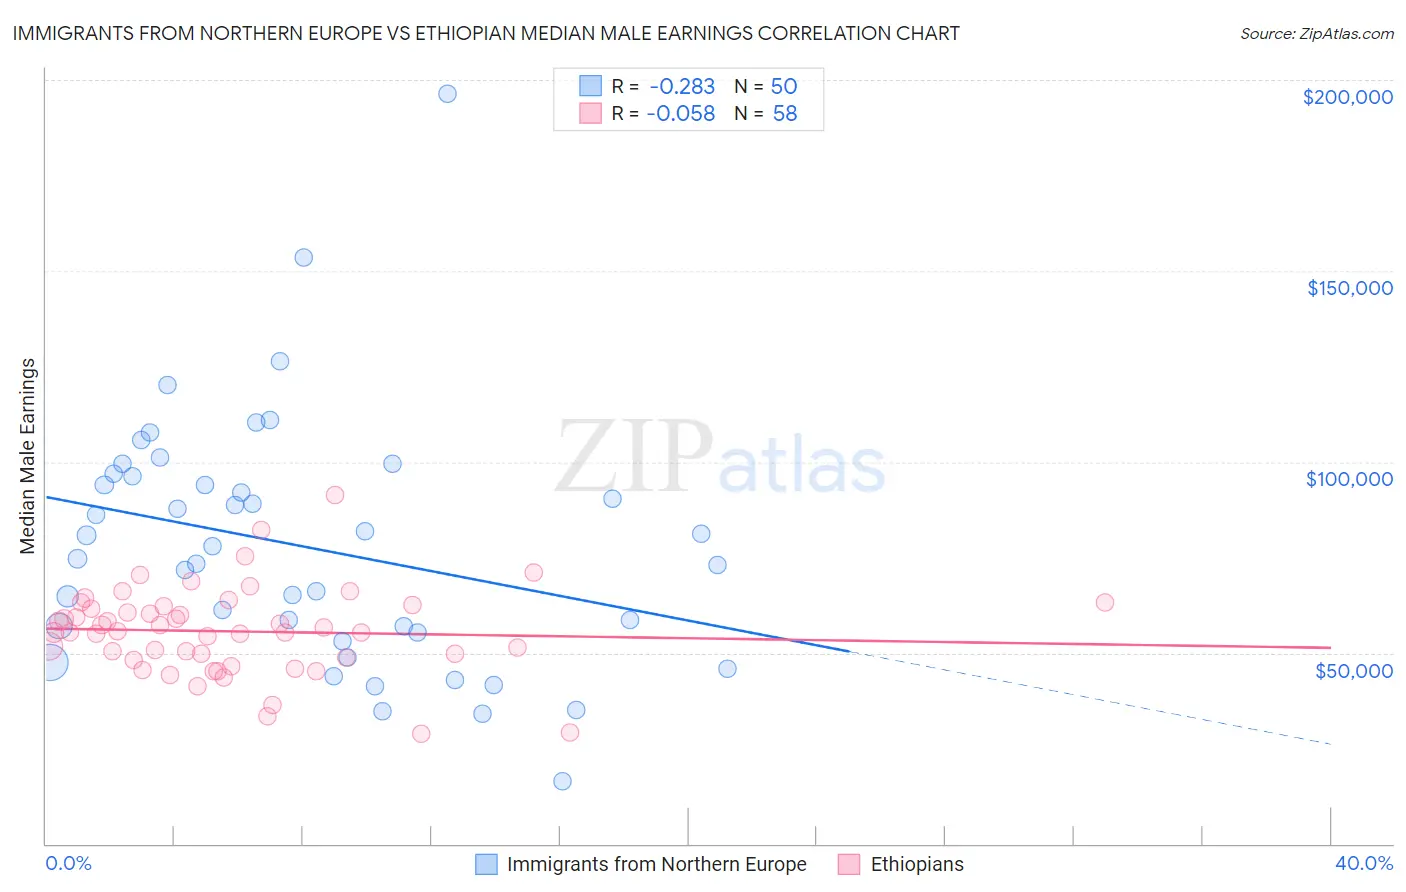
Immigrants from Northern Europe vs Ethiopian Median Male Earnings Correlation Chart
The statistical analysis conducted on geographies consisting of 476,848,141 people shows a weak negative correlation between the proportion of Immigrants from Northern Europe and median male earnings in the United States with a correlation coefficient (R) of -0.283 and weighted average of $64,987. Similarly, the statistical analysis conducted on geographies consisting of 223,246,505 people shows a slight negative correlation between the proportion of Ethiopians and median male earnings in the United States with a correlation coefficient (R) of -0.058 and weighted average of $56,243, a difference of 15.5%.
Median Male Earnings Correlation Summary
| Measurement | Immigrants from Northern Europe | Ethiopian |
| Minimum | $16,326 | $28,882 |
| Maximum | $196,250 | $91,333 |
| Range | $179,924 | $62,451 |
| Mean | $77,779 | $55,598 |
| Median | $76,341 | $55,634 |
| Interquartile 25% (IQ1) | $55,250 | $48,793 |
| Interquartile 75% (IQ3) | $96,105 | $62,132 |
| Interquartile Range (IQR) | $40,855 | $13,339 |
| Standard Deviation (Sample) | $32,560 | $11,505 |
| Standard Deviation (Population) | $32,233 | $11,405 |
Similar Demographics by Median Male Earnings
Demographics Similar to Immigrants from Northern Europe by Median Male Earnings
In terms of median male earnings, the demographic groups most similar to Immigrants from Northern Europe are Immigrants from Korea ($65,079, a difference of 0.14%), Burmese ($65,236, a difference of 0.38%), Immigrants from Denmark ($64,625, a difference of 0.56%), Immigrants from Sweden ($65,406, a difference of 0.65%), and Immigrants from Japan ($65,518, a difference of 0.82%).
| Demographics | Rating | Rank | Median Male Earnings |
| Immigrants | Belgium | 100.0 /100 | #17 | Exceptional $66,125 |
| Indians (Asian) | 100.0 /100 | #18 | Exceptional $66,078 |
| Cypriots | 100.0 /100 | #19 | Exceptional $65,549 |
| Immigrants | Japan | 100.0 /100 | #20 | Exceptional $65,518 |
| Immigrants | Sweden | 100.0 /100 | #21 | Exceptional $65,406 |
| Burmese | 100.0 /100 | #22 | Exceptional $65,236 |
| Immigrants | Korea | 100.0 /100 | #23 | Exceptional $65,079 |
| Immigrants | Northern Europe | 100.0 /100 | #24 | Exceptional $64,987 |
| Immigrants | Denmark | 100.0 /100 | #25 | Exceptional $64,625 |
| Turks | 100.0 /100 | #26 | Exceptional $64,253 |
| Immigrants | Switzerland | 100.0 /100 | #27 | Exceptional $63,944 |
| Russians | 100.0 /100 | #28 | Exceptional $63,939 |
| Asians | 100.0 /100 | #29 | Exceptional $63,827 |
| Immigrants | France | 100.0 /100 | #30 | Exceptional $63,715 |
| Latvians | 100.0 /100 | #31 | Exceptional $63,498 |
Demographics Similar to Ethiopians by Median Male Earnings
In terms of median male earnings, the demographic groups most similar to Ethiopians are Danish ($56,246, a difference of 0.0%), Zimbabwean ($56,302, a difference of 0.10%), Luxembourger ($56,300, a difference of 0.10%), Slovak ($56,306, a difference of 0.11%), and Sri Lankan ($56,136, a difference of 0.19%).
| Demographics | Rating | Rank | Median Male Earnings |
| Irish | 87.4 /100 | #135 | Excellent $56,464 |
| Immigrants | Saudi Arabia | 87.2 /100 | #136 | Excellent $56,452 |
| Slavs | 86.5 /100 | #137 | Excellent $56,390 |
| Slovaks | 85.5 /100 | #138 | Excellent $56,306 |
| Zimbabweans | 85.5 /100 | #139 | Excellent $56,302 |
| Luxembourgers | 85.5 /100 | #140 | Excellent $56,300 |
| Danes | 84.8 /100 | #141 | Excellent $56,246 |
| Ethiopians | 84.8 /100 | #142 | Excellent $56,243 |
| Sri Lankans | 83.4 /100 | #143 | Excellent $56,136 |
| Immigrants | Uganda | 82.4 /100 | #144 | Excellent $56,064 |
| Norwegians | 80.9 /100 | #145 | Excellent $55,965 |
| Immigrants | Chile | 80.7 /100 | #146 | Excellent $55,954 |
| Immigrants | Philippines | 78.4 /100 | #147 | Good $55,809 |
| Scottish | 78.2 /100 | #148 | Good $55,793 |
| English | 77.4 /100 | #149 | Good $55,747 |