Houma vs Ethiopian Median Male Earnings
COMPARE
Houma
Ethiopian
Median Male Earnings
Median Male Earnings Comparison
Houma
Ethiopians
$50,547
MEDIAN MALE EARNINGS
2.0/ 100
METRIC RATING
244th/ 347
METRIC RANK
$56,243
MEDIAN MALE EARNINGS
84.8/ 100
METRIC RATING
142nd/ 347
METRIC RANK
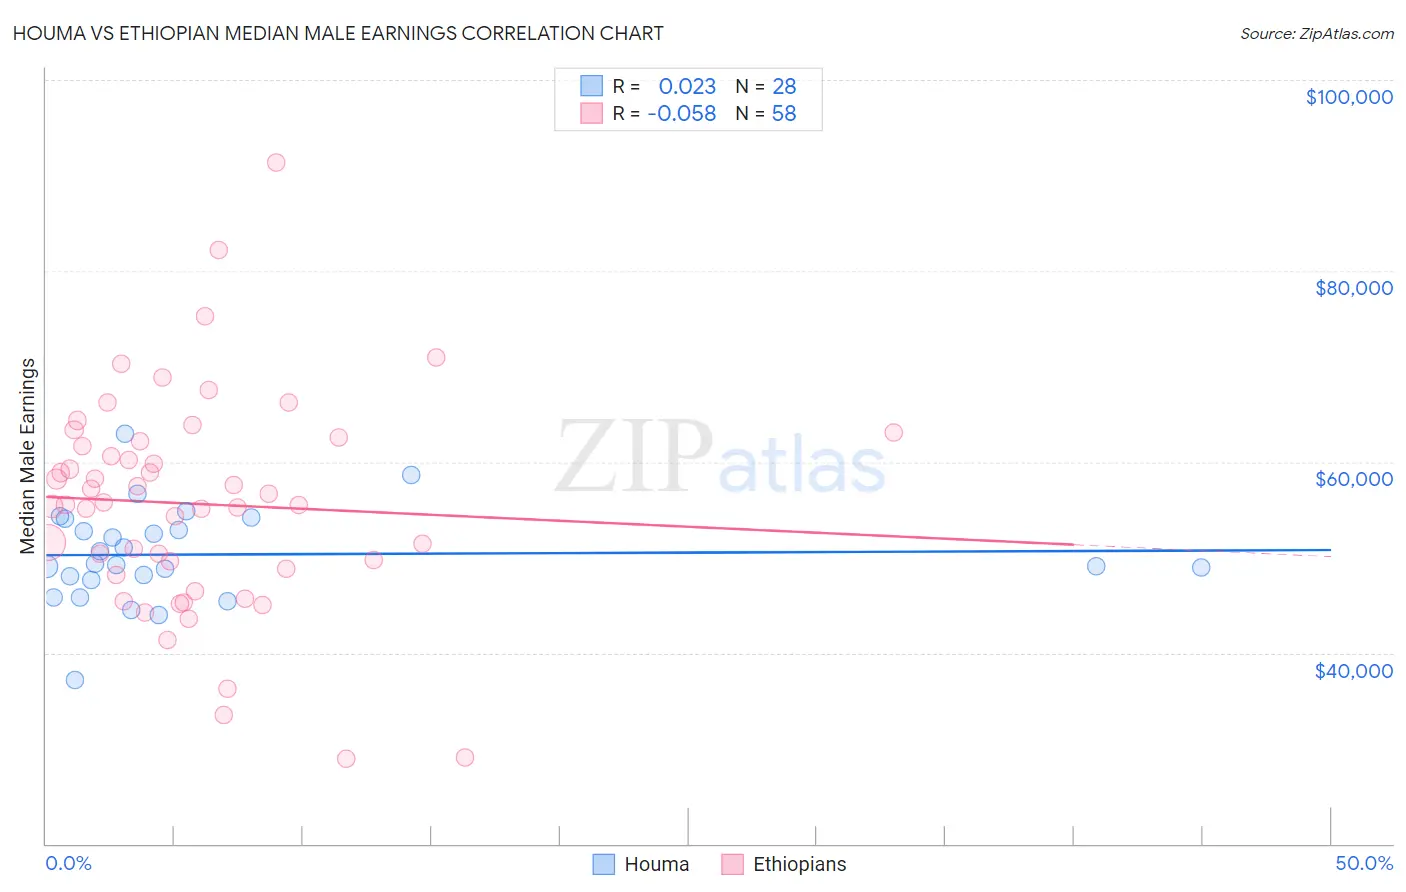
Houma vs Ethiopian Median Male Earnings Correlation Chart
The statistical analysis conducted on geographies consisting of 36,794,653 people shows no correlation between the proportion of Houma and median male earnings in the United States with a correlation coefficient (R) of 0.023 and weighted average of $50,547. Similarly, the statistical analysis conducted on geographies consisting of 223,246,505 people shows a slight negative correlation between the proportion of Ethiopians and median male earnings in the United States with a correlation coefficient (R) of -0.058 and weighted average of $56,243, a difference of 11.3%.
Median Male Earnings Correlation Summary
| Measurement | Houma | Ethiopian |
| Minimum | $37,208 | $28,882 |
| Maximum | $62,981 | $91,333 |
| Range | $25,773 | $62,451 |
| Mean | $50,295 | $55,598 |
| Median | $49,219 | $55,634 |
| Interquartile 25% (IQ1) | $47,813 | $48,793 |
| Interquartile 75% (IQ3) | $53,443 | $62,132 |
| Interquartile Range (IQR) | $5,630 | $13,339 |
| Standard Deviation (Sample) | $5,065 | $11,505 |
| Standard Deviation (Population) | $4,974 | $11,405 |
Similar Demographics by Median Male Earnings
Demographics Similar to Houma by Median Male Earnings
In terms of median male earnings, the demographic groups most similar to Houma are Hawaiian ($50,488, a difference of 0.12%), Guyanese ($50,613, a difference of 0.13%), French American Indian ($50,611, a difference of 0.13%), Immigrants from Ecuador ($50,474, a difference of 0.14%), and Immigrants from St. Vincent and the Grenadines ($50,665, a difference of 0.23%).
| Demographics | Rating | Rank | Median Male Earnings |
| Immigrants | Barbados | 2.6 /100 | #237 | Tragic $50,795 |
| Malaysians | 2.5 /100 | #238 | Tragic $50,772 |
| Americans | 2.5 /100 | #239 | Tragic $50,761 |
| West Indians | 2.3 /100 | #240 | Tragic $50,682 |
| Immigrants | St. Vincent and the Grenadines | 2.3 /100 | #241 | Tragic $50,665 |
| Guyanese | 2.2 /100 | #242 | Tragic $50,613 |
| French American Indians | 2.2 /100 | #243 | Tragic $50,611 |
| Houma | 2.0 /100 | #244 | Tragic $50,547 |
| Hawaiians | 1.9 /100 | #245 | Tragic $50,488 |
| Immigrants | Ecuador | 1.9 /100 | #246 | Tragic $50,474 |
| Sub-Saharan Africans | 1.8 /100 | #247 | Tragic $50,408 |
| Immigrants | Guyana | 1.6 /100 | #248 | Tragic $50,321 |
| Immigrants | Burma/Myanmar | 1.6 /100 | #249 | Tragic $50,298 |
| Osage | 1.6 /100 | #250 | Tragic $50,292 |
| Immigrants | Grenada | 1.6 /100 | #251 | Tragic $50,279 |
Demographics Similar to Ethiopians by Median Male Earnings
In terms of median male earnings, the demographic groups most similar to Ethiopians are Danish ($56,246, a difference of 0.0%), Zimbabwean ($56,302, a difference of 0.10%), Luxembourger ($56,300, a difference of 0.10%), Slovak ($56,306, a difference of 0.11%), and Sri Lankan ($56,136, a difference of 0.19%).
| Demographics | Rating | Rank | Median Male Earnings |
| Irish | 87.4 /100 | #135 | Excellent $56,464 |
| Immigrants | Saudi Arabia | 87.2 /100 | #136 | Excellent $56,452 |
| Slavs | 86.5 /100 | #137 | Excellent $56,390 |
| Slovaks | 85.5 /100 | #138 | Excellent $56,306 |
| Zimbabweans | 85.5 /100 | #139 | Excellent $56,302 |
| Luxembourgers | 85.5 /100 | #140 | Excellent $56,300 |
| Danes | 84.8 /100 | #141 | Excellent $56,246 |
| Ethiopians | 84.8 /100 | #142 | Excellent $56,243 |
| Sri Lankans | 83.4 /100 | #143 | Excellent $56,136 |
| Immigrants | Uganda | 82.4 /100 | #144 | Excellent $56,064 |
| Norwegians | 80.9 /100 | #145 | Excellent $55,965 |
| Immigrants | Chile | 80.7 /100 | #146 | Excellent $55,954 |
| Immigrants | Philippines | 78.4 /100 | #147 | Good $55,809 |
| Scottish | 78.2 /100 | #148 | Good $55,793 |
| English | 77.4 /100 | #149 | Good $55,747 |