Immigrants vs Immigrants from Kenya Median Household Income
COMPARE
Immigrants
Immigrants from Kenya
Median Household Income
Median Household Income Comparison
Immigrants
Immigrants from Kenya
$85,818
MEDIAN HOUSEHOLD INCOME
61.3/ 100
METRIC RATING
167th/ 347
METRIC RANK
$83,068
MEDIAN HOUSEHOLD INCOME
21.3/ 100
METRIC RATING
206th/ 347
METRIC RANK
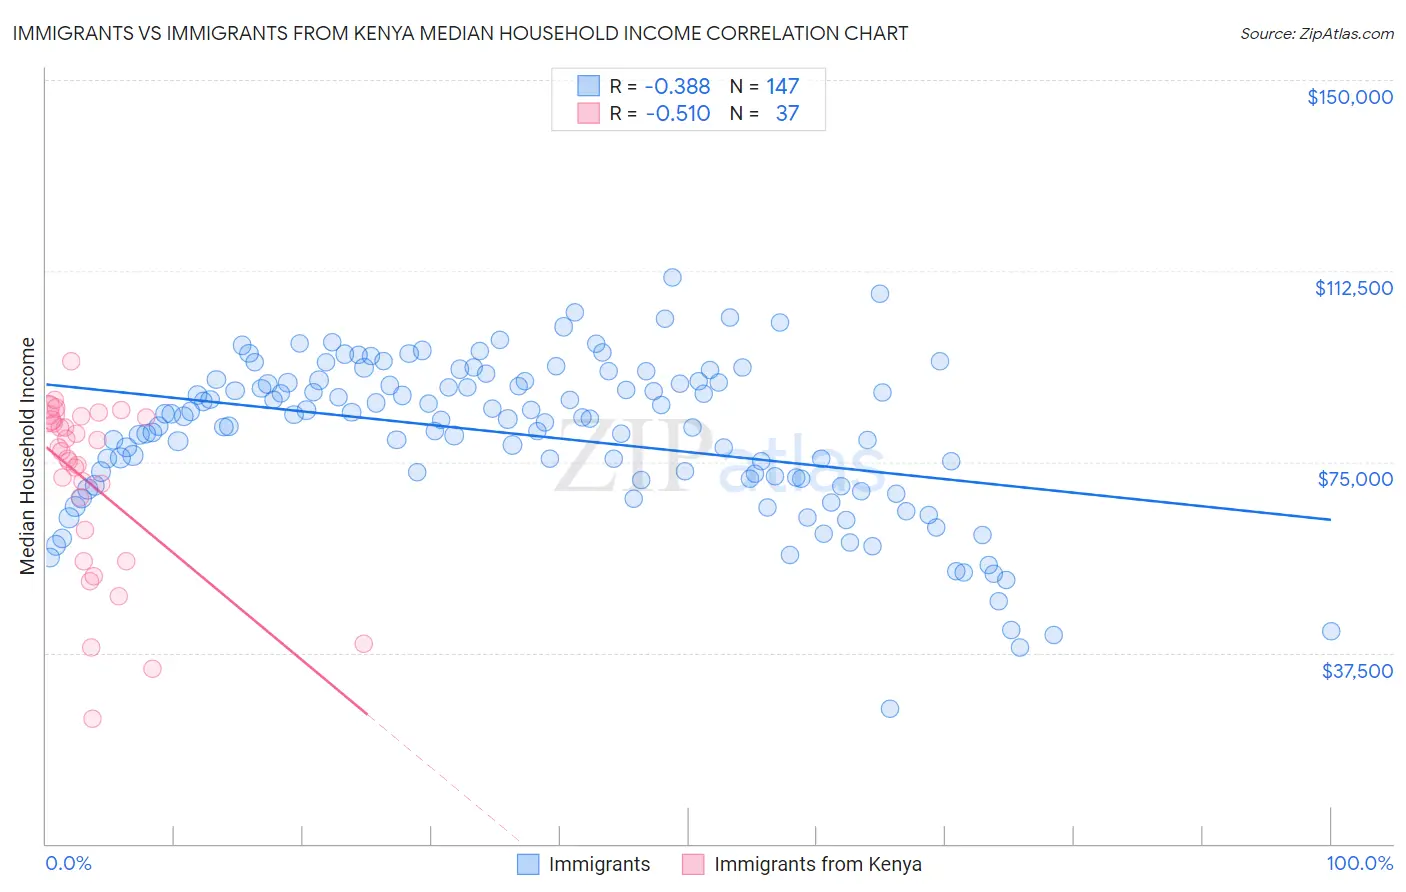
Immigrants vs Immigrants from Kenya Median Household Income Correlation Chart
The statistical analysis conducted on geographies consisting of 575,988,831 people shows a mild negative correlation between the proportion of Immigrants and median household income in the United States with a correlation coefficient (R) of -0.388 and weighted average of $85,818. Similarly, the statistical analysis conducted on geographies consisting of 217,959,858 people shows a substantial negative correlation between the proportion of Immigrants from Kenya and median household income in the United States with a correlation coefficient (R) of -0.510 and weighted average of $83,068, a difference of 3.3%.
Median Household Income Correlation Summary
| Measurement | Immigrants | Immigrants from Kenya |
| Minimum | $26,558 | $24,660 |
| Maximum | $111,218 | $94,729 |
| Range | $84,660 | $70,069 |
| Mean | $80,268 | $70,990 |
| Median | $83,546 | $77,036 |
| Interquartile 25% (IQ1) | $71,664 | $58,646 |
| Interquartile 75% (IQ3) | $90,776 | $83,895 |
| Interquartile Range (IQR) | $19,112 | $25,249 |
| Standard Deviation (Sample) | $15,311 | $17,137 |
| Standard Deviation (Population) | $15,259 | $16,903 |
Similar Demographics by Median Household Income
Demographics Similar to Immigrants by Median Household Income
In terms of median household income, the demographic groups most similar to Immigrants are Icelander ($85,797, a difference of 0.020%), Colombian ($85,716, a difference of 0.12%), Swiss ($85,681, a difference of 0.16%), Immigrants from South America ($85,611, a difference of 0.24%), and Scandinavian ($86,073, a difference of 0.30%).
| Demographics | Rating | Rank | Median Household Income |
| Luxembourgers | 70.0 /100 | #160 | Good $86,418 |
| Slavs | 69.7 /100 | #161 | Good $86,398 |
| Guamanians/Chamorros | 67.7 /100 | #162 | Good $86,255 |
| Czechs | 66.4 /100 | #163 | Good $86,164 |
| Irish | 66.2 /100 | #164 | Good $86,145 |
| Norwegians | 65.3 /100 | #165 | Good $86,084 |
| Scandinavians | 65.1 /100 | #166 | Good $86,073 |
| Immigrants | Immigrants | 61.3 /100 | #167 | Good $85,818 |
| Icelanders | 61.0 /100 | #168 | Good $85,797 |
| Colombians | 59.7 /100 | #169 | Average $85,716 |
| Swiss | 59.2 /100 | #170 | Average $85,681 |
| Immigrants | South America | 58.1 /100 | #171 | Average $85,611 |
| Slovenes | 57.4 /100 | #172 | Average $85,562 |
| Immigrants | Cameroon | 53.4 /100 | #173 | Average $85,314 |
| Scottish | 50.0 /100 | #174 | Average $85,101 |
Demographics Similar to Immigrants from Kenya by Median Household Income
In terms of median household income, the demographic groups most similar to Immigrants from Kenya are Dutch ($82,971, a difference of 0.12%), Celtic ($83,193, a difference of 0.15%), Immigrants from Africa ($83,289, a difference of 0.27%), Immigrants from Cambodia ($83,304, a difference of 0.28%), and Immigrants from Thailand ($83,327, a difference of 0.31%).
| Demographics | Rating | Rank | Median Household Income |
| Germans | 24.6 /100 | #199 | Fair $83,358 |
| Tsimshian | 24.5 /100 | #200 | Fair $83,346 |
| Spanish | 24.4 /100 | #201 | Fair $83,343 |
| Immigrants | Thailand | 24.3 /100 | #202 | Fair $83,327 |
| Immigrants | Cambodia | 24.0 /100 | #203 | Fair $83,304 |
| Immigrants | Africa | 23.8 /100 | #204 | Fair $83,289 |
| Celtics | 22.7 /100 | #205 | Fair $83,193 |
| Immigrants | Kenya | 21.3 /100 | #206 | Fair $83,068 |
| Dutch | 20.3 /100 | #207 | Fair $82,971 |
| French Canadians | 18.7 /100 | #208 | Poor $82,810 |
| Immigrants | Iraq | 16.7 /100 | #209 | Poor $82,594 |
| Immigrants | Uruguay | 16.4 /100 | #210 | Poor $82,560 |
| Salvadorans | 15.4 /100 | #211 | Poor $82,449 |
| Venezuelans | 15.3 /100 | #212 | Poor $82,432 |
| Nepalese | 15.1 /100 | #213 | Poor $82,410 |