Immigrants vs Jamaican Median Household Income
COMPARE
Immigrants
Jamaican
Median Household Income
Median Household Income Comparison
Immigrants
Jamaicans
$85,818
MEDIAN HOUSEHOLD INCOME
61.3/ 100
METRIC RATING
167th/ 347
METRIC RANK
$76,583
MEDIAN HOUSEHOLD INCOME
0.4/ 100
METRIC RATING
260th/ 347
METRIC RANK
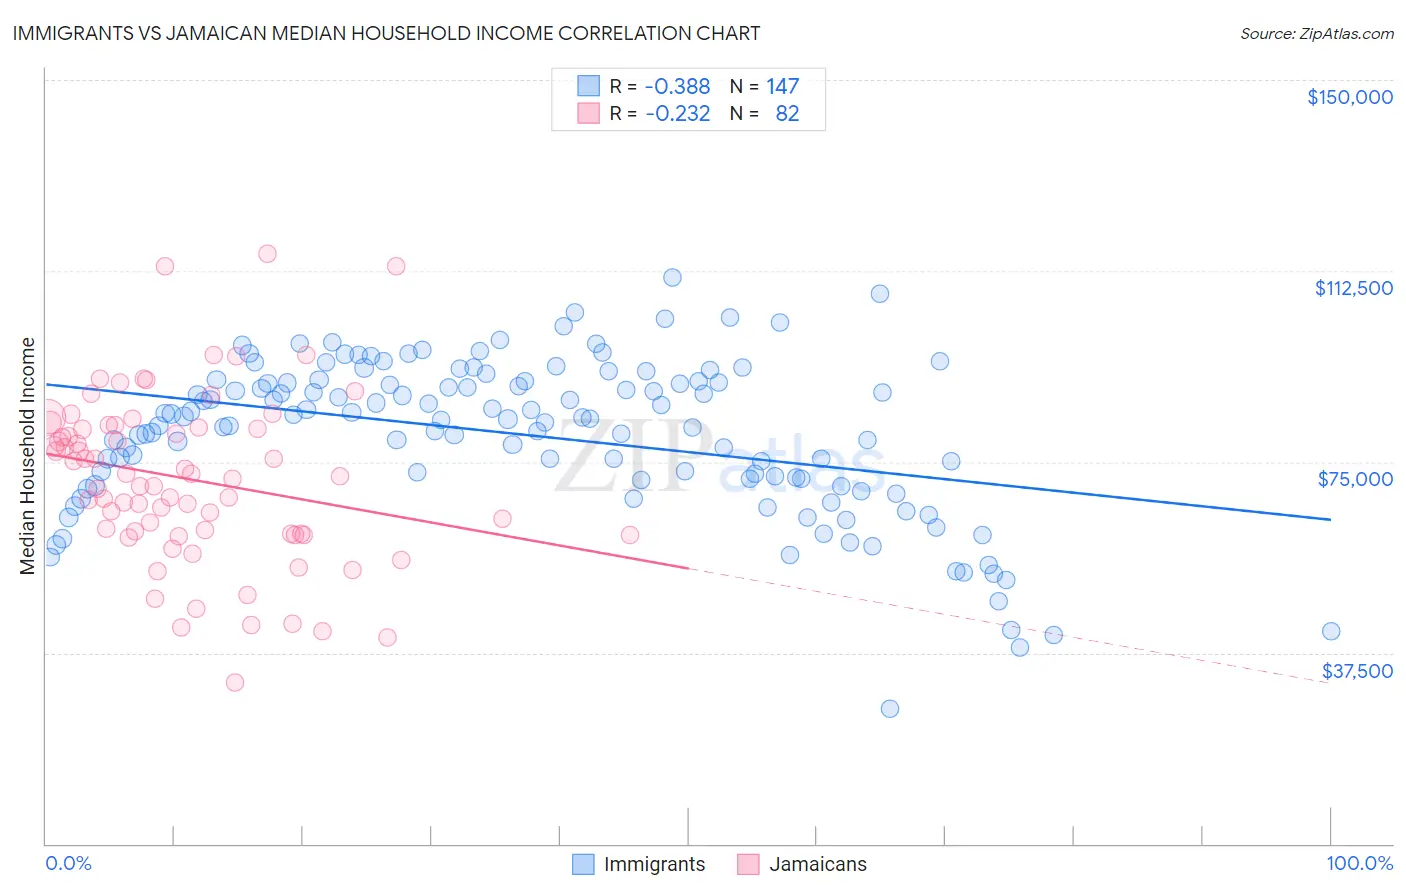
Immigrants vs Jamaican Median Household Income Correlation Chart
The statistical analysis conducted on geographies consisting of 575,988,831 people shows a mild negative correlation between the proportion of Immigrants and median household income in the United States with a correlation coefficient (R) of -0.388 and weighted average of $85,818. Similarly, the statistical analysis conducted on geographies consisting of 367,555,449 people shows a weak negative correlation between the proportion of Jamaicans and median household income in the United States with a correlation coefficient (R) of -0.232 and weighted average of $76,583, a difference of 12.1%.
Median Household Income Correlation Summary
| Measurement | Immigrants | Jamaican |
| Minimum | $26,558 | $31,580 |
| Maximum | $111,218 | $115,872 |
| Range | $84,660 | $84,292 |
| Mean | $80,268 | $71,605 |
| Median | $83,546 | $71,865 |
| Interquartile 25% (IQ1) | $71,664 | $60,801 |
| Interquartile 75% (IQ3) | $90,776 | $81,812 |
| Interquartile Range (IQR) | $19,112 | $21,011 |
| Standard Deviation (Sample) | $15,311 | $16,569 |
| Standard Deviation (Population) | $15,259 | $16,468 |
Similar Demographics by Median Household Income
Demographics Similar to Immigrants by Median Household Income
In terms of median household income, the demographic groups most similar to Immigrants are Icelander ($85,797, a difference of 0.020%), Colombian ($85,716, a difference of 0.12%), Swiss ($85,681, a difference of 0.16%), Immigrants from South America ($85,611, a difference of 0.24%), and Scandinavian ($86,073, a difference of 0.30%).
| Demographics | Rating | Rank | Median Household Income |
| Luxembourgers | 70.0 /100 | #160 | Good $86,418 |
| Slavs | 69.7 /100 | #161 | Good $86,398 |
| Guamanians/Chamorros | 67.7 /100 | #162 | Good $86,255 |
| Czechs | 66.4 /100 | #163 | Good $86,164 |
| Irish | 66.2 /100 | #164 | Good $86,145 |
| Norwegians | 65.3 /100 | #165 | Good $86,084 |
| Scandinavians | 65.1 /100 | #166 | Good $86,073 |
| Immigrants | Immigrants | 61.3 /100 | #167 | Good $85,818 |
| Icelanders | 61.0 /100 | #168 | Good $85,797 |
| Colombians | 59.7 /100 | #169 | Average $85,716 |
| Swiss | 59.2 /100 | #170 | Average $85,681 |
| Immigrants | South America | 58.1 /100 | #171 | Average $85,611 |
| Slovenes | 57.4 /100 | #172 | Average $85,562 |
| Immigrants | Cameroon | 53.4 /100 | #173 | Average $85,314 |
| Scottish | 50.0 /100 | #174 | Average $85,101 |
Demographics Similar to Jamaicans by Median Household Income
In terms of median household income, the demographic groups most similar to Jamaicans are Immigrants from Grenada ($76,517, a difference of 0.090%), Spanish American Indian ($76,670, a difference of 0.11%), Immigrants from Nicaragua ($76,784, a difference of 0.26%), French American Indian ($76,387, a difference of 0.26%), and Alaskan Athabascan ($76,383, a difference of 0.26%).
| Demographics | Rating | Rank | Median Household Income |
| Immigrants | St. Vincent and the Grenadines | 0.9 /100 | #253 | Tragic $77,690 |
| Sub-Saharan Africans | 0.8 /100 | #254 | Tragic $77,631 |
| Immigrants | Middle Africa | 0.8 /100 | #255 | Tragic $77,559 |
| Belizeans | 0.6 /100 | #256 | Tragic $77,028 |
| Immigrants | Senegal | 0.5 /100 | #257 | Tragic $76,915 |
| Immigrants | Nicaragua | 0.5 /100 | #258 | Tragic $76,784 |
| Spanish American Indians | 0.4 /100 | #259 | Tragic $76,670 |
| Jamaicans | 0.4 /100 | #260 | Tragic $76,583 |
| Immigrants | Grenada | 0.4 /100 | #261 | Tragic $76,517 |
| French American Indians | 0.4 /100 | #262 | Tragic $76,387 |
| Alaskan Athabascans | 0.4 /100 | #263 | Tragic $76,383 |
| Guatemalans | 0.3 /100 | #264 | Tragic $75,961 |
| Immigrants | Belize | 0.3 /100 | #265 | Tragic $75,938 |
| Americans | 0.3 /100 | #266 | Tragic $75,932 |
| German Russians | 0.3 /100 | #267 | Tragic $75,856 |