Seminole vs Immigrants from Kenya Median Household Income
COMPARE
Seminole
Immigrants from Kenya
Median Household Income
Median Household Income Comparison
Seminole
Immigrants from Kenya
$69,420
MEDIAN HOUSEHOLD INCOME
0.0/ 100
METRIC RATING
325th/ 347
METRIC RANK
$83,068
MEDIAN HOUSEHOLD INCOME
21.3/ 100
METRIC RATING
206th/ 347
METRIC RANK
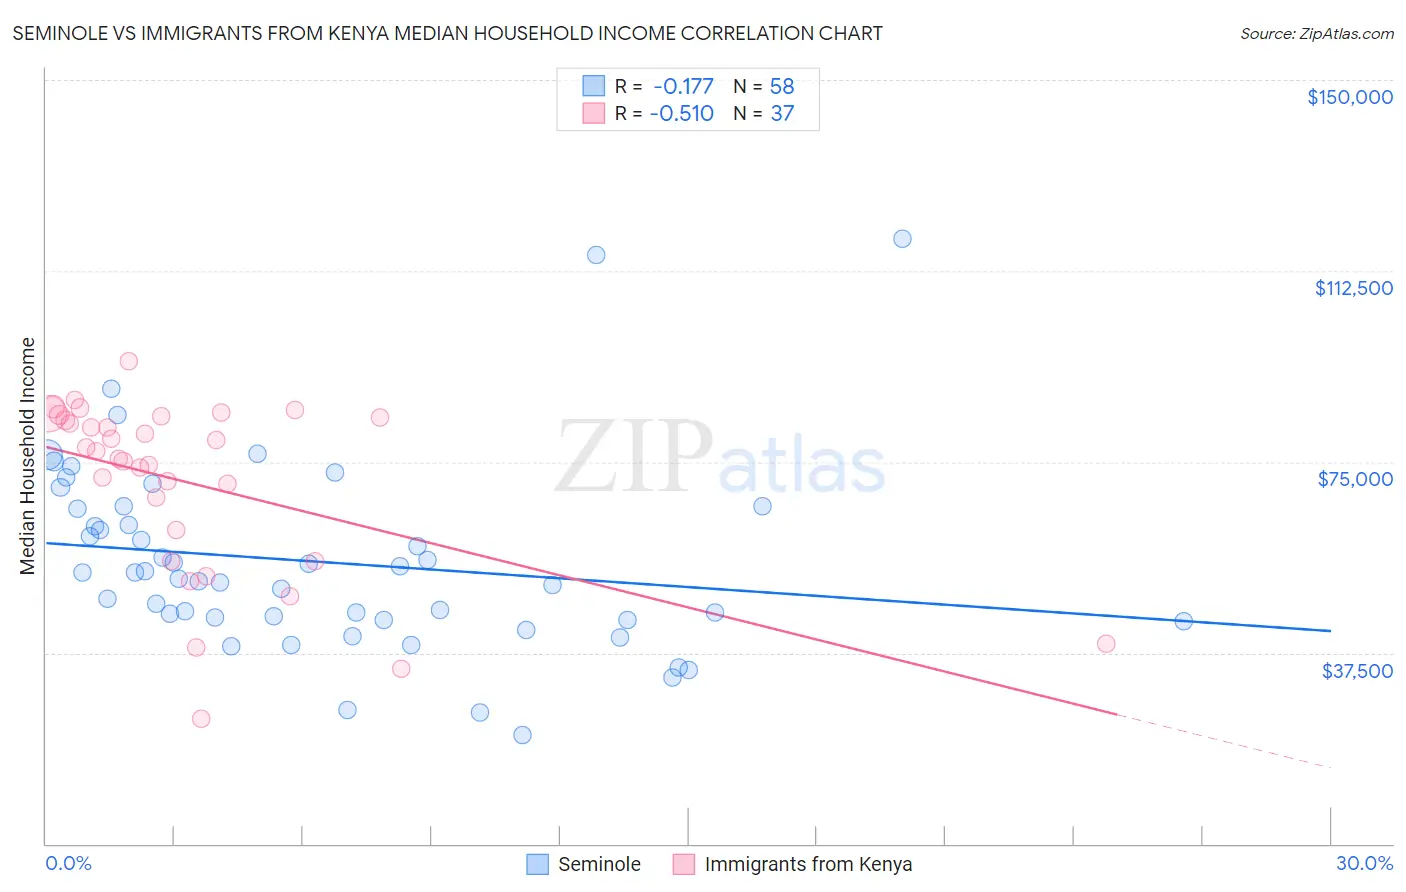
Seminole vs Immigrants from Kenya Median Household Income Correlation Chart
The statistical analysis conducted on geographies consisting of 118,297,671 people shows a poor negative correlation between the proportion of Seminole and median household income in the United States with a correlation coefficient (R) of -0.177 and weighted average of $69,420. Similarly, the statistical analysis conducted on geographies consisting of 217,959,858 people shows a substantial negative correlation between the proportion of Immigrants from Kenya and median household income in the United States with a correlation coefficient (R) of -0.510 and weighted average of $83,068, a difference of 19.7%.
Median Household Income Correlation Summary
| Measurement | Seminole | Immigrants from Kenya |
| Minimum | $21,429 | $24,660 |
| Maximum | $118,750 | $94,729 |
| Range | $97,321 | $70,069 |
| Mean | $55,357 | $70,990 |
| Median | $52,689 | $77,036 |
| Interquartile 25% (IQ1) | $44,050 | $58,646 |
| Interquartile 75% (IQ3) | $65,850 | $83,895 |
| Interquartile Range (IQR) | $21,800 | $25,249 |
| Standard Deviation (Sample) | $18,667 | $17,137 |
| Standard Deviation (Population) | $18,505 | $16,903 |
Similar Demographics by Median Household Income
Demographics Similar to Seminole by Median Household Income
In terms of median household income, the demographic groups most similar to Seminole are Yup'ik ($69,695, a difference of 0.40%), Bahamian ($69,726, a difference of 0.44%), Choctaw ($69,947, a difference of 0.76%), Chickasaw ($70,005, a difference of 0.84%), and Colville ($70,094, a difference of 0.97%).
| Demographics | Rating | Rank | Median Household Income |
| Chippewa | 0.0 /100 | #318 | Tragic $70,539 |
| Immigrants | Dominican Republic | 0.0 /100 | #319 | Tragic $70,208 |
| Colville | 0.0 /100 | #320 | Tragic $70,094 |
| Chickasaw | 0.0 /100 | #321 | Tragic $70,005 |
| Choctaw | 0.0 /100 | #322 | Tragic $69,947 |
| Bahamians | 0.0 /100 | #323 | Tragic $69,726 |
| Yup'ik | 0.0 /100 | #324 | Tragic $69,695 |
| Seminole | 0.0 /100 | #325 | Tragic $69,420 |
| Yuman | 0.0 /100 | #326 | Tragic $68,743 |
| Immigrants | Cuba | 0.0 /100 | #327 | Tragic $68,461 |
| Menominee | 0.0 /100 | #328 | Tragic $68,423 |
| Dutch West Indians | 0.0 /100 | #329 | Tragic $68,412 |
| Arapaho | 0.0 /100 | #330 | Tragic $67,965 |
| Natives/Alaskans | 0.0 /100 | #331 | Tragic $67,879 |
| Sioux | 0.0 /100 | #332 | Tragic $67,792 |
Demographics Similar to Immigrants from Kenya by Median Household Income
In terms of median household income, the demographic groups most similar to Immigrants from Kenya are Dutch ($82,971, a difference of 0.12%), Celtic ($83,193, a difference of 0.15%), Immigrants from Africa ($83,289, a difference of 0.27%), Immigrants from Cambodia ($83,304, a difference of 0.28%), and Immigrants from Thailand ($83,327, a difference of 0.31%).
| Demographics | Rating | Rank | Median Household Income |
| Germans | 24.6 /100 | #199 | Fair $83,358 |
| Tsimshian | 24.5 /100 | #200 | Fair $83,346 |
| Spanish | 24.4 /100 | #201 | Fair $83,343 |
| Immigrants | Thailand | 24.3 /100 | #202 | Fair $83,327 |
| Immigrants | Cambodia | 24.0 /100 | #203 | Fair $83,304 |
| Immigrants | Africa | 23.8 /100 | #204 | Fair $83,289 |
| Celtics | 22.7 /100 | #205 | Fair $83,193 |
| Immigrants | Kenya | 21.3 /100 | #206 | Fair $83,068 |
| Dutch | 20.3 /100 | #207 | Fair $82,971 |
| French Canadians | 18.7 /100 | #208 | Poor $82,810 |
| Immigrants | Iraq | 16.7 /100 | #209 | Poor $82,594 |
| Immigrants | Uruguay | 16.4 /100 | #210 | Poor $82,560 |
| Salvadorans | 15.4 /100 | #211 | Poor $82,449 |
| Venezuelans | 15.3 /100 | #212 | Poor $82,432 |
| Nepalese | 15.1 /100 | #213 | Poor $82,410 |