Immigrants vs Immigrants from Chile Median Household Income
COMPARE
Immigrants
Immigrants from Chile
Median Household Income
Median Household Income Comparison
Immigrants
Immigrants from Chile
$85,818
MEDIAN HOUSEHOLD INCOME
61.3/ 100
METRIC RATING
167th/ 347
METRIC RANK
$88,388
MEDIAN HOUSEHOLD INCOME
89.2/ 100
METRIC RATING
139th/ 347
METRIC RANK
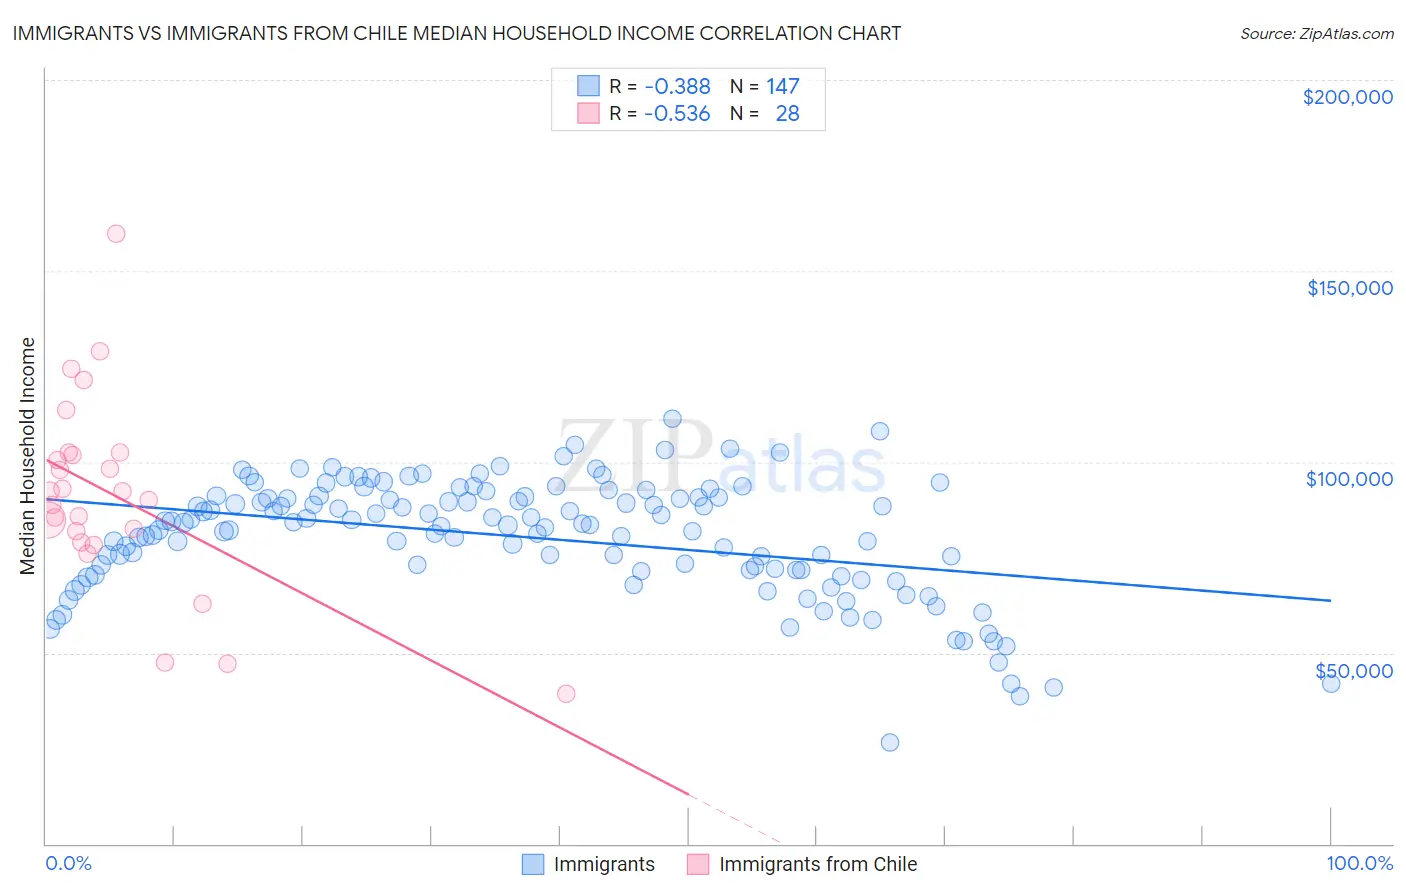
Immigrants vs Immigrants from Chile Median Household Income Correlation Chart
The statistical analysis conducted on geographies consisting of 575,988,831 people shows a mild negative correlation between the proportion of Immigrants and median household income in the United States with a correlation coefficient (R) of -0.388 and weighted average of $85,818. Similarly, the statistical analysis conducted on geographies consisting of 218,579,752 people shows a substantial negative correlation between the proportion of Immigrants from Chile and median household income in the United States with a correlation coefficient (R) of -0.536 and weighted average of $88,388, a difference of 3.0%.
Median Household Income Correlation Summary
| Measurement | Immigrants | Immigrants from Chile |
| Minimum | $26,558 | $39,375 |
| Maximum | $111,218 | $159,688 |
| Range | $84,660 | $120,313 |
| Mean | $80,268 | $91,361 |
| Median | $83,546 | $91,251 |
| Interquartile 25% (IQ1) | $71,664 | $80,247 |
| Interquartile 75% (IQ3) | $90,776 | $102,116 |
| Interquartile Range (IQR) | $19,112 | $21,868 |
| Standard Deviation (Sample) | $15,311 | $25,347 |
| Standard Deviation (Population) | $15,259 | $24,890 |
Similar Demographics by Median Household Income
Demographics Similar to Immigrants by Median Household Income
In terms of median household income, the demographic groups most similar to Immigrants are Icelander ($85,797, a difference of 0.020%), Colombian ($85,716, a difference of 0.12%), Swiss ($85,681, a difference of 0.16%), Immigrants from South America ($85,611, a difference of 0.24%), and Scandinavian ($86,073, a difference of 0.30%).
| Demographics | Rating | Rank | Median Household Income |
| Luxembourgers | 70.0 /100 | #160 | Good $86,418 |
| Slavs | 69.7 /100 | #161 | Good $86,398 |
| Guamanians/Chamorros | 67.7 /100 | #162 | Good $86,255 |
| Czechs | 66.4 /100 | #163 | Good $86,164 |
| Irish | 66.2 /100 | #164 | Good $86,145 |
| Norwegians | 65.3 /100 | #165 | Good $86,084 |
| Scandinavians | 65.1 /100 | #166 | Good $86,073 |
| Immigrants | Immigrants | 61.3 /100 | #167 | Good $85,818 |
| Icelanders | 61.0 /100 | #168 | Good $85,797 |
| Colombians | 59.7 /100 | #169 | Average $85,716 |
| Swiss | 59.2 /100 | #170 | Average $85,681 |
| Immigrants | South America | 58.1 /100 | #171 | Average $85,611 |
| Slovenes | 57.4 /100 | #172 | Average $85,562 |
| Immigrants | Cameroon | 53.4 /100 | #173 | Average $85,314 |
| Scottish | 50.0 /100 | #174 | Average $85,101 |
Demographics Similar to Immigrants from Chile by Median Household Income
In terms of median household income, the demographic groups most similar to Immigrants from Chile are Arab ($88,398, a difference of 0.010%), Sierra Leonean ($88,463, a difference of 0.080%), Polish ($88,472, a difference of 0.090%), Immigrants from Sierra Leone ($88,498, a difference of 0.12%), and Swedish ($88,524, a difference of 0.15%).
| Demographics | Rating | Rank | Median Household Income |
| Europeans | 91.2 /100 | #132 | Exceptional $88,751 |
| Immigrants | Ethiopia | 90.9 /100 | #133 | Exceptional $88,687 |
| Swedes | 90.0 /100 | #134 | Exceptional $88,524 |
| Immigrants | Sierra Leone | 89.9 /100 | #135 | Excellent $88,498 |
| Poles | 89.7 /100 | #136 | Excellent $88,472 |
| Sierra Leoneans | 89.6 /100 | #137 | Excellent $88,463 |
| Arabs | 89.2 /100 | #138 | Excellent $88,398 |
| Immigrants | Chile | 89.2 /100 | #139 | Excellent $88,388 |
| Lebanese | 87.2 /100 | #140 | Excellent $88,091 |
| Immigrants | Morocco | 86.0 /100 | #141 | Excellent $87,930 |
| Canadians | 84.7 /100 | #142 | Excellent $87,769 |
| Danes | 83.9 /100 | #143 | Excellent $87,676 |
| Serbians | 83.0 /100 | #144 | Excellent $87,572 |
| Ugandans | 82.9 /100 | #145 | Excellent $87,557 |
| Immigrants | Uganda | 82.8 /100 | #146 | Excellent $87,553 |