Immigrants from Western Europe vs Immigrants from Sweden Male Disability

COMPARE

Immigrants from Western Europe
Race
Ancestry
AfghanAfricanAlaska NativeAlaskan AthabascanAlbanianAleutAlsatianAmericanApacheArabArapahoArgentineanArmenianAssyrian/Chaldean/SyriacAustralianAustrianBahamianBangladeshiBarbadianBasqueBelgianBelizeanBermudanBhutaneseBlackfeetBolivianBrazilianBritishBritish West IndianBulgarianBurmeseCajunCambodianCanadianCape VerdeanCarpatho RusynCelticCentral AmericanCentral American IndianCherokeeCheyenneChickasawChileanChineseChippewaChoctawColombianColvilleComancheCosta RicanCreeCreekCroatianCrowCubanCypriotCzechCzechoslovakianDanishDelawareDominicanDutchDutch West IndianEastern EuropeanEcuadorianEgyptianEnglishEstonianEthiopianEuropeanFijianFilipinoFinnishFrenchFrench American IndianFrench CanadianGermanGerman RussianGhanaianGreekGuamanian/ChamorroGuatemalanGuyaneseHaitianHmongHonduranHopiHoumaHungarianIcelanderIndian (Asian)IndonesianInupiatIranianIraqiIrishIroquoisIsraeliItalianJamaicanJapaneseJordanianKenyanKiowaKoreanLaotianLatvianLebaneseLiberianLithuanianLumbeeLuxembourgerMacedonianMalaysianMalteseMarshalleseMenomineeMexicanMexican American IndianMongolianMoroccanNative HawaiianNavajoNepaleseNew ZealanderNicaraguanNigerianNorthern EuropeanNorwegianOkinawanOsageOttawaPaiutePakistaniPalestinianPanamanianParaguayanPennsylvania GermanPeruvianPimaPolishPortuguesePotawatomiPuebloPuerto RicanPuget Sound SalishRomanianRussianSalvadoranSamoanScandinavianScotch-IrishScottishSeminoleSenegaleseSerbianShoshoneSierra LeoneanSiouxSlavicSlovakSloveneSomaliSouth AfricanSouth AmericanSouth American IndianSoviet UnionSpaniardSpanishSpanish AmericanSpanish American IndianSri LankanSubsaharan AfricanSudaneseSwedishSwissSyrianTaiwaneseThaiTlingit-HaidaTohono O'OdhamTonganTrinidadian and TobagonianTsimshianTurkishU.S. Virgin IslanderUgandanUkrainianUruguayanUteVenezuelanVietnameseWelshWest IndianYakamaYaquiYugoslavianYumanYup'ikZimbabwean
Immigration
NonimmigrantsImmigrantsAfghanistanAfricaAlbaniaArgentinaArmeniaAsiaAustraliaAustriaBahamasBangladeshBarbadosBelarusBelgiumBelizeBoliviaBosnia and HerzegovinaBrazilBulgariaBurma/MyanmarCabo VerdeCambodiaCameroonCanadaCaribbeanCentral AmericaChileChinaColombiaCongoCosta RicaCroatiaCubaCzechoslovakiaDenmarkDominicaDominican RepublicEastern AfricaEastern AsiaEastern EuropeEcuadorEgyptEl SalvadorEnglandEritreaEthiopiaEuropeFijiFranceGermanyGhanaGreeceGrenadaGuatemalaGuyanaHaitiHondurasHong KongHungaryIndiaIndonesiaIranIraqIrelandIsraelItalyJamaicaJapanJordanKazakhstanKenyaKoreaKuwaitLaosLatin AmericaLatviaLebanonLiberiaLithuaniaMalaysiaMexicoMicronesiaMiddle AfricaMoldovaMoroccoNepalNetherlandsNicaraguaNigeriaNorth AmericaNorth MacedoniaNorthern AfricaNorthern EuropeNorwayOceaniaPakistanPanamaPeruPhilippinesPolandPortugalRomaniaRussiaSaudi ArabiaScotlandSenegalSerbiaSierra LeoneSingaporeSomaliaSouth AfricaSouth AmericaSouth Central AsiaSouth Eastern AsiaSouthern EuropeSpainSri LankaSt. Vincent and the GrenadinesSudanSwitzerlandSyriaTaiwanThailandTrinidad and TobagoTurkeyUgandaUkraineUruguayUzbekistanVenezuelaVietnamWest IndiesWestern AfricaWestern AsiaWestern EuropeYemenZaireZimbabweAzores
Immigrants from Sweden
Race
Ancestry
AfghanAfricanAlaska NativeAlaskan AthabascanAlbanianAleutAlsatianAmericanApacheArabArapahoArgentineanArmenianAssyrian/Chaldean/SyriacAustralianAustrianBahamianBangladeshiBarbadianBasqueBelgianBelizeanBermudanBhutaneseBlackfeetBolivianBrazilianBritishBritish West IndianBulgarianBurmeseCajunCambodianCanadianCape VerdeanCarpatho RusynCelticCentral AmericanCentral American IndianCherokeeCheyenneChickasawChileanChineseChippewaChoctawColombianColvilleComancheCosta RicanCreeCreekCroatianCrowCubanCypriotCzechCzechoslovakianDanishDelawareDominicanDutchDutch West IndianEastern EuropeanEcuadorianEgyptianEnglishEstonianEthiopianEuropeanFijianFilipinoFinnishFrenchFrench American IndianFrench CanadianGermanGerman RussianGhanaianGreekGuamanian/ChamorroGuatemalanGuyaneseHaitianHmongHonduranHopiHoumaHungarianIcelanderIndian (Asian)IndonesianInupiatIranianIraqiIrishIroquoisIsraeliItalianJamaicanJapaneseJordanianKenyanKiowaKoreanLaotianLatvianLebaneseLiberianLithuanianLumbeeLuxembourgerMacedonianMalaysianMalteseMarshalleseMenomineeMexicanMexican American IndianMongolianMoroccanNative HawaiianNavajoNepaleseNew ZealanderNicaraguanNigerianNorthern EuropeanNorwegianOkinawanOsageOttawaPaiutePakistaniPalestinianPanamanianParaguayanPennsylvania GermanPeruvianPimaPolishPortuguesePotawatomiPuebloPuerto RicanPuget Sound SalishRomanianRussianSalvadoranSamoanScandinavianScotch-IrishScottishSeminoleSenegaleseSerbianShoshoneSierra LeoneanSiouxSlavicSlovakSloveneSomaliSouth AfricanSouth AmericanSouth American IndianSoviet UnionSpaniardSpanishSpanish AmericanSpanish American IndianSri LankanSubsaharan AfricanSudaneseSwedishSwissSyrianTaiwaneseThaiTlingit-HaidaTohono O'OdhamTonganTrinidadian and TobagonianTsimshianTurkishU.S. Virgin IslanderUgandanUkrainianUruguayanUteVenezuelanVietnameseWelshWest IndianYakamaYaquiYugoslavianYumanYup'ikZimbabwean
Immigration
NonimmigrantsImmigrantsAfghanistanAfricaAlbaniaArgentinaArmeniaAsiaAustraliaAustriaBahamasBangladeshBarbadosBelarusBelgiumBelizeBoliviaBosnia and HerzegovinaBrazilBulgariaBurma/MyanmarCabo VerdeCambodiaCameroonCanadaCaribbeanCentral AmericaChileChinaColombiaCongoCosta RicaCroatiaCubaCzechoslovakiaDenmarkDominicaDominican RepublicEastern AfricaEastern AsiaEastern EuropeEcuadorEgyptEl SalvadorEnglandEritreaEthiopiaEuropeFijiFranceGermanyGhanaGreeceGrenadaGuatemalaGuyanaHaitiHondurasHong KongHungaryIndiaIndonesiaIranIraqIrelandIsraelItalyJamaicaJapanJordanKazakhstanKenyaKoreaKuwaitLaosLatin AmericaLatviaLebanonLiberiaLithuaniaMalaysiaMexicoMicronesiaMiddle AfricaMoldovaMoroccoNepalNetherlandsNicaraguaNigeriaNorth AmericaNorth MacedoniaNorthern AfricaNorthern EuropeNorwayOceaniaPakistanPanamaPeruPhilippinesPolandPortugalRomaniaRussiaSaudi ArabiaScotlandSenegalSerbiaSierra LeoneSingaporeSomaliaSouth AfricaSouth AmericaSouth Central AsiaSouth Eastern AsiaSouthern EuropeSpainSri LankaSt. Vincent and the GrenadinesSudanSwedenSwitzerlandSyriaTaiwanThailandTrinidad and TobagoTurkeyUgandaUkraineUruguayUzbekistanVenezuelaVietnamWest IndiesWestern AfricaWestern AsiaYemenZaireZimbabweAzores
Male Disability
Income
Poverty
Unemployment
Labor Participation
Family Structure
Vehicle Availability
Education Level
Disability

Male Disability Comparison

Immigrants from Western Europe

Immigrants from Sweden

Tragic
Exceptional
11.7%
MALE DISABILITY
3.8/ 100
METRIC RATING
220th/ 347
METRIC RANK
10.7%
MALE DISABILITY
96.9/ 100
METRIC RATING
94th/ 347
METRIC RANK

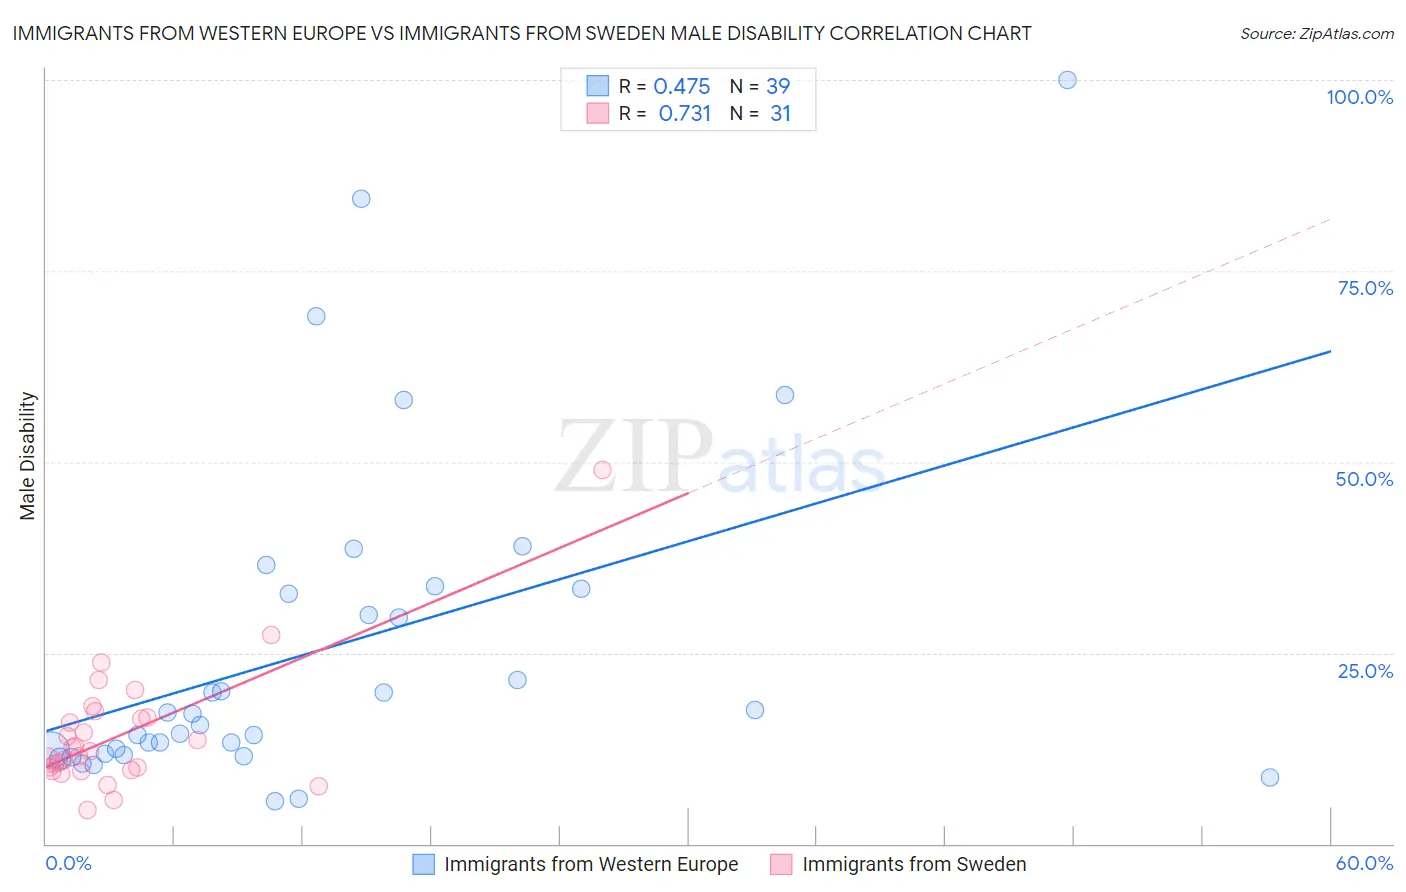
Immigrants from Western Europe vs Immigrants from Sweden Male Disability Correlation Chart

The statistical analysis conducted on geographies consisting of 494,010,238 people shows a moderate positive correlation between the proportion of Immigrants from Western Europe and percentage of males with a disability in the United States with a correlation coefficient (R) of 0.475 and weighted average of 11.7%. Similarly, the statistical analysis conducted on geographies consisting of 164,748,272 people shows a strong positive correlation between the proportion of Immigrants from Sweden and percentage of males with a disability in the United States with a correlation coefficient (R) of 0.731 and weighted average of 10.7%, a difference of 9.7%.
Immigrants from Western Europe vs Immigrants from Sweden Male Disability

Male Disability Correlation Summary

MeasurementImmigrants from Western EuropeImmigrants from Sweden
Minimum5.5%4.4%
Maximum100.0%49.0%
Range94.5%44.6%
Mean25.6%14.3%
Median17.1%12.1%
Interquartile 25% (IQ1)11.8%9.7%
Interquartile 75% (IQ3)33.3%16.6%
Interquartile Range (IQR)21.6%6.9%
Standard Deviation (Sample)21.7%8.2%
Standard Deviation (Population)21.4%8.1%

Similar Demographics by Male Disability

Demographics Similar to Immigrants from Western Europe by Male Disability

In terms of male disability, the demographic groups most similar to Immigrants from Western Europe are Panamanian (11.7%, a difference of 0.010%), Immigrants from Congo (11.7%, a difference of 0.010%), Immigrants from England (11.7%, a difference of 0.070%), Alsatian (11.7%, a difference of 0.17%), and Immigrants from Bahamas (11.7%, a difference of 0.25%).
DemographicsRating | RankMale Disability
Mexican American Indians
7.8
/100
|
#213
Tragic
11.6%
Lithuanians
6.6
/100
|
#214
Tragic
11.6%
Indonesians
5.9
/100
|
#215
Tragic
11.6%
Immigrants | Dominican Republic
4.9
/100
|
#216
Tragic
11.7%
Immigrants | Dominica
4.6
/100
|
#217
Tragic
11.7%
Immigrants | England
4.0
/100
|
#218
Tragic
11.7%
Panamanians
3.8
/100
|
#219
Tragic
11.7%
Immigrants | Western Europe
3.8
/100
|
#220
Tragic
11.7%
Immigrants | Congo
3.7
/100
|
#221
Tragic
11.7%
Alsatians
3.3
/100
|
#222
Tragic
11.7%
Immigrants | Bahamas
3.2
/100
|
#223
Tragic
11.7%
Japanese
3.1
/100
|
#224
Tragic
11.7%
Liberians
3.1
/100
|
#225
Tragic
11.8%
Sub-Saharan Africans
2.8
/100
|
#226
Tragic
11.8%
Austrians
2.5
/100
|
#227
Tragic
11.8%

Demographics Similar to Immigrants from Sweden by Male Disability

In terms of male disability, the demographic groups most similar to Immigrants from Sweden are Chilean (10.7%, a difference of 0.030%), Immigrants from St. Vincent and the Grenadines (10.7%, a difference of 0.11%), Nicaraguan (10.7%, a difference of 0.13%), Immigrants from Armenia (10.7%, a difference of 0.15%), and Immigrants from Romania (10.7%, a difference of 0.21%).
DemographicsRating | RankMale Disability
Immigrants | Vietnam
97.9
/100
|
#87
Exceptional
10.6%
Immigrants | Western Asia
97.8
/100
|
#88
Exceptional
10.6%
Immigrants | Nicaragua
97.8
/100
|
#89
Exceptional
10.6%
Immigrants | Morocco
97.7
/100
|
#90
Exceptional
10.6%
Immigrants | France
97.6
/100
|
#91
Exceptional
10.6%
Palestinians
97.4
/100
|
#92
Exceptional
10.7%
Immigrants | St. Vincent and the Grenadines
97.1
/100
|
#93
Exceptional
10.7%
Immigrants | Sweden
96.9
/100
|
#94
Exceptional
10.7%
Chileans
96.9
/100
|
#95
Exceptional
10.7%
Nicaraguans
96.6
/100
|
#96
Exceptional
10.7%
Immigrants | Armenia
96.6
/100
|
#97
Exceptional
10.7%
Immigrants | Romania
96.5
/100
|
#98
Exceptional
10.7%
Immigrants | Switzerland
96.1
/100
|
#99
Exceptional
10.7%
Immigrants | Kazakhstan
95.9
/100
|
#100
Exceptional
10.7%
Immigrants | Greece
95.6
/100
|
#101
Exceptional
10.7%