Immigrants from Uruguay vs Immigrants from Italy Wage/Income Gap
COMPARE
Immigrants from Uruguay
Immigrants from Italy
Wage/Income Gap
Wage/Income Gap Comparison
Immigrants from Uruguay
Immigrants from Italy
24.6%
WAGE/INCOME GAP
93.8/ 100
METRIC RATING
126th/ 347
METRIC RANK
26.5%
WAGE/INCOME GAP
15.8/ 100
METRIC RATING
207th/ 347
METRIC RANK
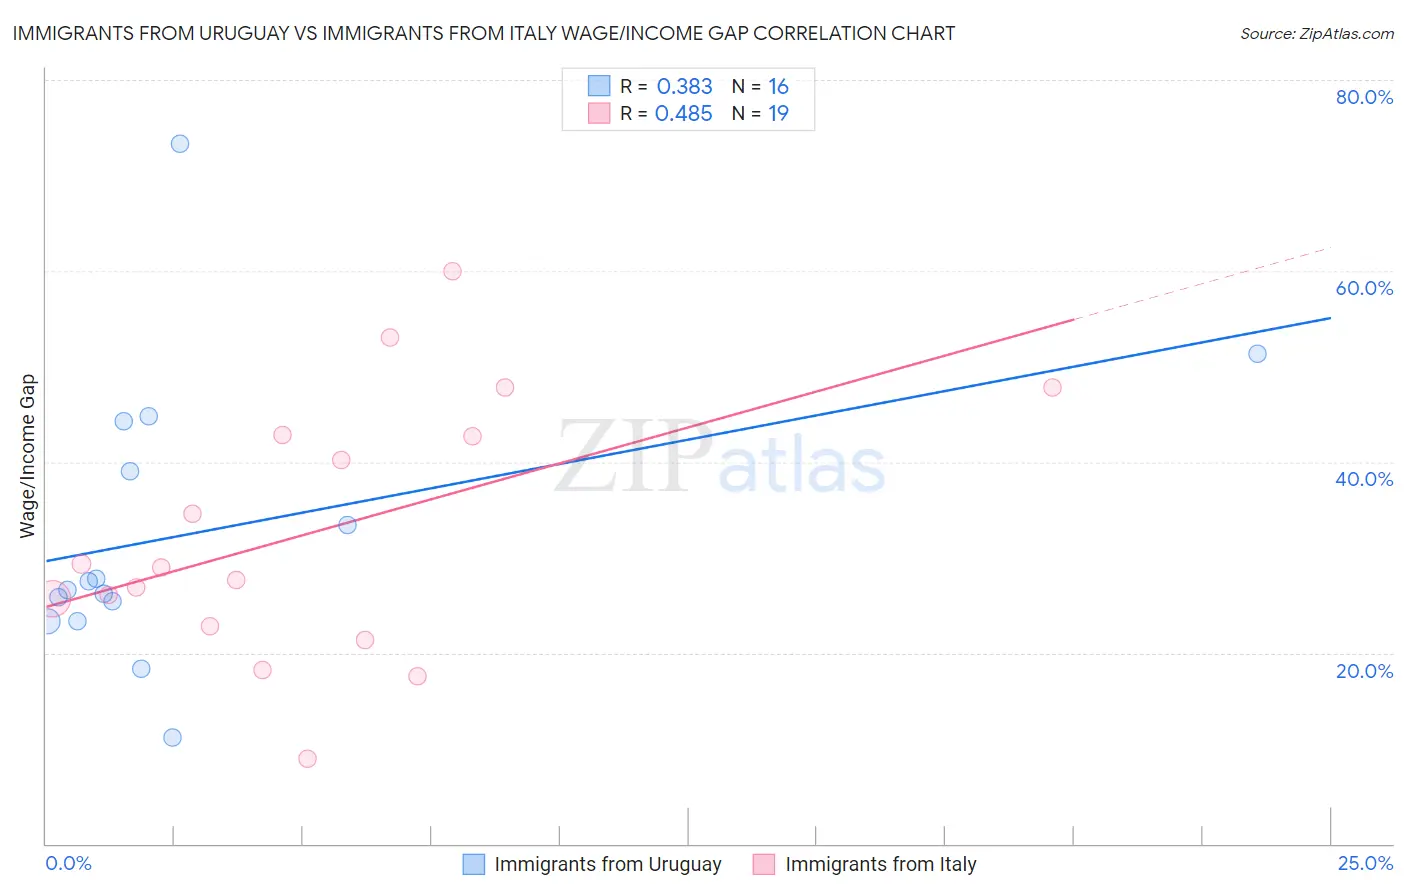
Immigrants from Uruguay vs Immigrants from Italy Wage/Income Gap Correlation Chart
The statistical analysis conducted on geographies consisting of 133,243,894 people shows a mild positive correlation between the proportion of Immigrants from Uruguay and wage/income gap percentage in the United States with a correlation coefficient (R) of 0.383 and weighted average of 24.6%. Similarly, the statistical analysis conducted on geographies consisting of 324,019,244 people shows a moderate positive correlation between the proportion of Immigrants from Italy and wage/income gap percentage in the United States with a correlation coefficient (R) of 0.485 and weighted average of 26.5%, a difference of 7.5%.
Wage/Income Gap Correlation Summary
| Measurement | Immigrants from Uruguay | Immigrants from Italy |
| Minimum | 11.1% | 8.9% |
| Maximum | 73.3% | 60.0% |
| Range | 62.2% | 51.1% |
| Mean | 32.6% | 32.7% |
| Median | 27.1% | 28.9% |
| Interquartile 25% (IQ1) | 24.3% | 22.8% |
| Interquartile 75% (IQ3) | 41.7% | 42.8% |
| Interquartile Range (IQR) | 17.3% | 19.9% |
| Standard Deviation (Sample) | 15.1% | 13.5% |
| Standard Deviation (Population) | 14.6% | 13.2% |
Similar Demographics by Wage/Income Gap
Demographics Similar to Immigrants from Uruguay by Wage/Income Gap
In terms of wage/income gap, the demographic groups most similar to Immigrants from Uruguay are German Russian (24.6%, a difference of 0.010%), Spanish American (24.6%, a difference of 0.020%), Immigrants from South America (24.6%, a difference of 0.040%), Immigrants from Central America (24.6%, a difference of 0.070%), and Yup'ik (24.7%, a difference of 0.13%).
| Demographics | Rating | Rank | Wage/Income Gap |
| Kenyans | 95.8 /100 | #119 | Exceptional 24.5% |
| Cree | 95.6 /100 | #120 | Exceptional 24.5% |
| Immigrants | Thailand | 94.9 /100 | #121 | Exceptional 24.5% |
| Apache | 94.8 /100 | #122 | Exceptional 24.5% |
| Natives/Alaskans | 94.6 /100 | #123 | Exceptional 24.6% |
| Immigrants | South America | 93.9 /100 | #124 | Exceptional 24.6% |
| Spanish Americans | 93.8 /100 | #125 | Exceptional 24.6% |
| Immigrants | Uruguay | 93.8 /100 | #126 | Exceptional 24.6% |
| German Russians | 93.7 /100 | #127 | Exceptional 24.6% |
| Immigrants | Central America | 93.5 /100 | #128 | Exceptional 24.6% |
| Yup'ik | 93.3 /100 | #129 | Exceptional 24.7% |
| Alsatians | 93.2 /100 | #130 | Exceptional 24.7% |
| Immigrants | Philippines | 93.0 /100 | #131 | Exceptional 24.7% |
| Immigrants | Costa Rica | 92.4 /100 | #132 | Exceptional 24.7% |
| Colombians | 92.4 /100 | #133 | Exceptional 24.7% |
Demographics Similar to Immigrants from Italy by Wage/Income Gap
In terms of wage/income gap, the demographic groups most similar to Immigrants from Italy are Indian (Asian) (26.4%, a difference of 0.080%), Immigrants from Southern Europe (26.4%, a difference of 0.17%), Immigrants from Russia (26.4%, a difference of 0.35%), Laotian (26.4%, a difference of 0.37%), and Immigrants from Eastern Europe (26.4%, a difference of 0.37%).
| Demographics | Rating | Rank | Wage/Income Gap |
| Delaware | 20.9 /100 | #200 | Fair 26.3% |
| Immigrants | Syria | 19.3 /100 | #201 | Poor 26.4% |
| Laotians | 19.2 /100 | #202 | Poor 26.4% |
| Immigrants | Eastern Europe | 19.2 /100 | #203 | Poor 26.4% |
| Immigrants | Russia | 19.0 /100 | #204 | Poor 26.4% |
| Immigrants | Southern Europe | 17.3 /100 | #205 | Poor 26.4% |
| Indians (Asian) | 16.5 /100 | #206 | Poor 26.4% |
| Immigrants | Italy | 15.8 /100 | #207 | Poor 26.5% |
| Egyptians | 12.7 /100 | #208 | Poor 26.6% |
| Immigrants | Kuwait | 12.6 /100 | #209 | Poor 26.6% |
| Arabs | 12.3 /100 | #210 | Poor 26.6% |
| Mongolians | 11.4 /100 | #211 | Poor 26.6% |
| Iraqis | 11.2 /100 | #212 | Poor 26.6% |
| Immigrants | Iraq | 10.3 /100 | #213 | Poor 26.7% |
| Immigrants | China | 10.3 /100 | #214 | Poor 26.7% |