Canadian vs Immigrants from Italy Wage/Income Gap
COMPARE
Canadian
Immigrants from Italy
Wage/Income Gap
Wage/Income Gap Comparison
Canadians
Immigrants from Italy
28.1%
WAGE/INCOME GAP
0.3/ 100
METRIC RATING
289th/ 347
METRIC RANK
26.5%
WAGE/INCOME GAP
15.8/ 100
METRIC RATING
207th/ 347
METRIC RANK
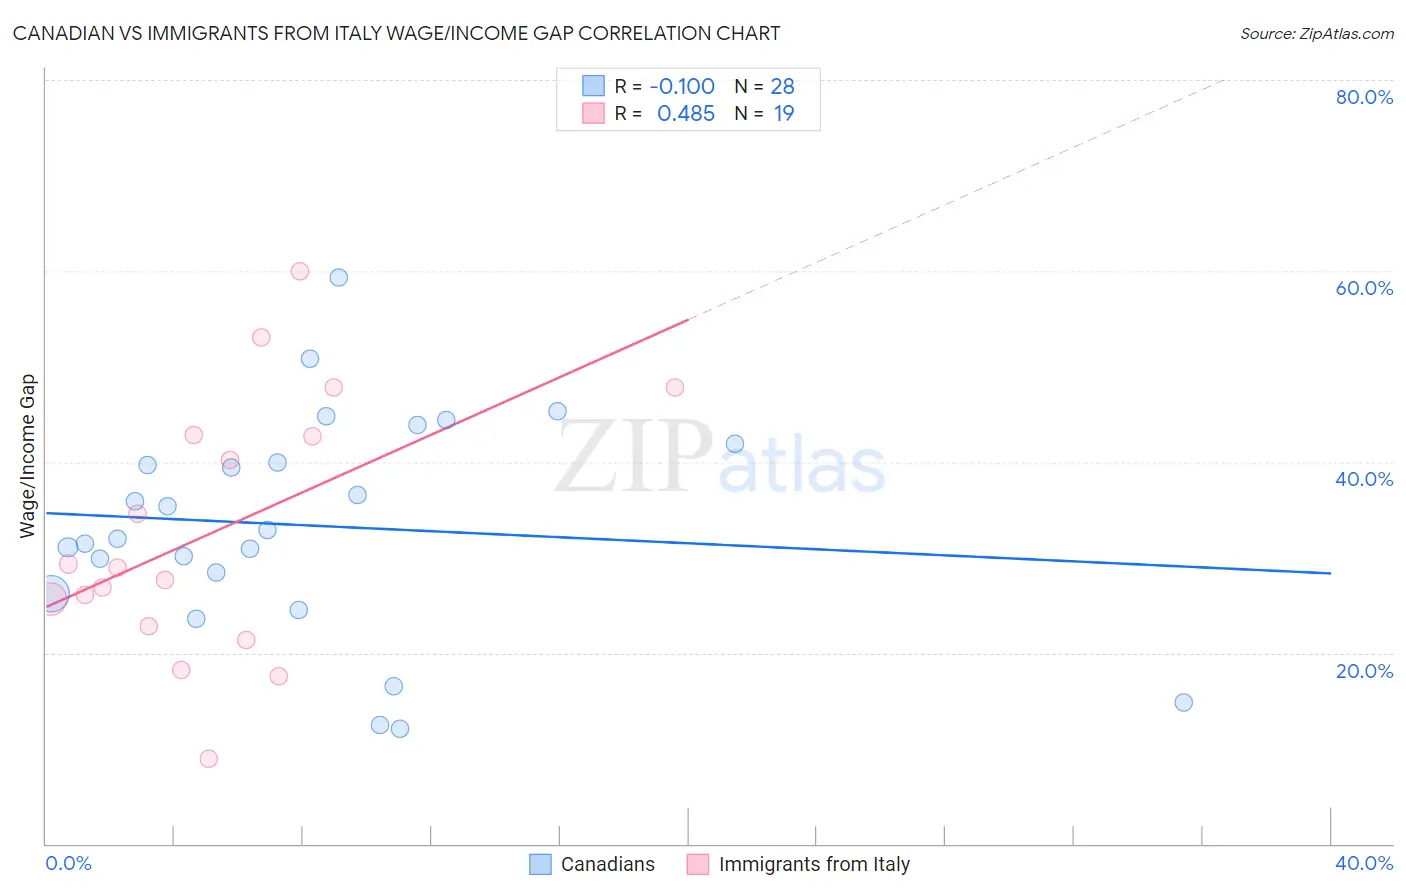
Canadian vs Immigrants from Italy Wage/Income Gap Correlation Chart
The statistical analysis conducted on geographies consisting of 437,073,113 people shows a slight negative correlation between the proportion of Canadians and wage/income gap percentage in the United States with a correlation coefficient (R) of -0.100 and weighted average of 28.1%. Similarly, the statistical analysis conducted on geographies consisting of 324,019,244 people shows a moderate positive correlation between the proportion of Immigrants from Italy and wage/income gap percentage in the United States with a correlation coefficient (R) of 0.485 and weighted average of 26.5%, a difference of 6.3%.
Wage/Income Gap Correlation Summary
| Measurement | Canadian | Immigrants from Italy |
| Minimum | 12.0% | 8.9% |
| Maximum | 59.3% | 60.0% |
| Range | 47.3% | 51.1% |
| Mean | 33.3% | 32.7% |
| Median | 32.4% | 28.9% |
| Interquartile 25% (IQ1) | 27.3% | 22.8% |
| Interquartile 75% (IQ3) | 40.9% | 42.8% |
| Interquartile Range (IQR) | 13.6% | 19.9% |
| Standard Deviation (Sample) | 11.4% | 13.5% |
| Standard Deviation (Population) | 11.2% | 13.2% |
Similar Demographics by Wage/Income Gap
Demographics Similar to Canadians by Wage/Income Gap
In terms of wage/income gap, the demographic groups most similar to Canadians are Choctaw (28.1%, a difference of 0.030%), Okinawan (28.1%, a difference of 0.070%), Australian (28.2%, a difference of 0.090%), Immigrants from Austria (28.1%, a difference of 0.11%), and Italian (28.1%, a difference of 0.14%).
| Demographics | Rating | Rank | Wage/Income Gap |
| South Africans | 0.5 /100 | #282 | Tragic 28.0% |
| French Canadians | 0.4 /100 | #283 | Tragic 28.1% |
| Immigrants | Sweden | 0.4 /100 | #284 | Tragic 28.1% |
| Italians | 0.4 /100 | #285 | Tragic 28.1% |
| Immigrants | Austria | 0.4 /100 | #286 | Tragic 28.1% |
| Okinawans | 0.4 /100 | #287 | Tragic 28.1% |
| Choctaw | 0.4 /100 | #288 | Tragic 28.1% |
| Canadians | 0.3 /100 | #289 | Tragic 28.1% |
| Australians | 0.3 /100 | #290 | Tragic 28.2% |
| Czechoslovakians | 0.3 /100 | #291 | Tragic 28.2% |
| Immigrants | Australia | 0.3 /100 | #292 | Tragic 28.2% |
| Immigrants | Israel | 0.3 /100 | #293 | Tragic 28.2% |
| Greeks | 0.3 /100 | #294 | Tragic 28.2% |
| Slovenes | 0.3 /100 | #295 | Tragic 28.3% |
| Northern Europeans | 0.3 /100 | #296 | Tragic 28.3% |
Demographics Similar to Immigrants from Italy by Wage/Income Gap
In terms of wage/income gap, the demographic groups most similar to Immigrants from Italy are Indian (Asian) (26.4%, a difference of 0.080%), Immigrants from Southern Europe (26.4%, a difference of 0.17%), Immigrants from Russia (26.4%, a difference of 0.35%), Laotian (26.4%, a difference of 0.37%), and Immigrants from Eastern Europe (26.4%, a difference of 0.37%).
| Demographics | Rating | Rank | Wage/Income Gap |
| Delaware | 20.9 /100 | #200 | Fair 26.3% |
| Immigrants | Syria | 19.3 /100 | #201 | Poor 26.4% |
| Laotians | 19.2 /100 | #202 | Poor 26.4% |
| Immigrants | Eastern Europe | 19.2 /100 | #203 | Poor 26.4% |
| Immigrants | Russia | 19.0 /100 | #204 | Poor 26.4% |
| Immigrants | Southern Europe | 17.3 /100 | #205 | Poor 26.4% |
| Indians (Asian) | 16.5 /100 | #206 | Poor 26.4% |
| Immigrants | Italy | 15.8 /100 | #207 | Poor 26.5% |
| Egyptians | 12.7 /100 | #208 | Poor 26.6% |
| Immigrants | Kuwait | 12.6 /100 | #209 | Poor 26.6% |
| Arabs | 12.3 /100 | #210 | Poor 26.6% |
| Mongolians | 11.4 /100 | #211 | Poor 26.6% |
| Iraqis | 11.2 /100 | #212 | Poor 26.6% |
| Immigrants | Iraq | 10.3 /100 | #213 | Poor 26.7% |
| Immigrants | China | 10.3 /100 | #214 | Poor 26.7% |