American vs Immigrants from Italy Wage/Income Gap
COMPARE
American
Immigrants from Italy
Wage/Income Gap
Wage/Income Gap Comparison
Americans
Immigrants from Italy
27.8%
WAGE/INCOME GAP
0.7/ 100
METRIC RATING
274th/ 347
METRIC RANK
26.5%
WAGE/INCOME GAP
15.8/ 100
METRIC RATING
207th/ 347
METRIC RANK
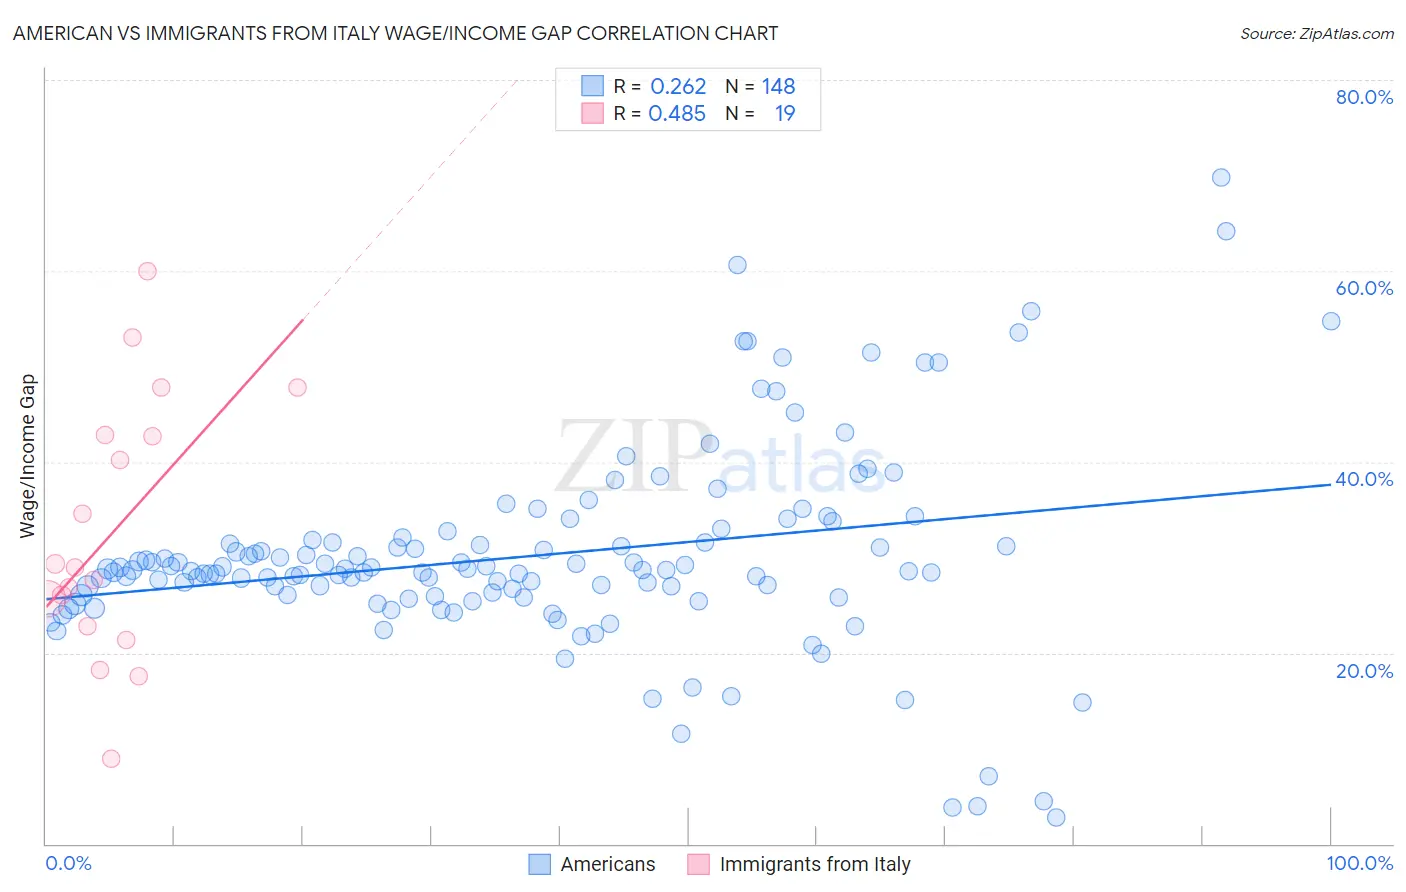
American vs Immigrants from Italy Wage/Income Gap Correlation Chart
The statistical analysis conducted on geographies consisting of 577,977,110 people shows a weak positive correlation between the proportion of Americans and wage/income gap percentage in the United States with a correlation coefficient (R) of 0.262 and weighted average of 27.8%. Similarly, the statistical analysis conducted on geographies consisting of 324,019,244 people shows a moderate positive correlation between the proportion of Immigrants from Italy and wage/income gap percentage in the United States with a correlation coefficient (R) of 0.485 and weighted average of 26.5%, a difference of 5.2%.
Wage/Income Gap Correlation Summary
| Measurement | American | Immigrants from Italy |
| Minimum | 2.7% | 8.9% |
| Maximum | 69.8% | 60.0% |
| Range | 67.1% | 51.1% |
| Mean | 30.2% | 32.7% |
| Median | 28.7% | 28.9% |
| Interquartile 25% (IQ1) | 26.0% | 22.8% |
| Interquartile 75% (IQ3) | 31.7% | 42.8% |
| Interquartile Range (IQR) | 5.7% | 19.9% |
| Standard Deviation (Sample) | 10.5% | 13.5% |
| Standard Deviation (Population) | 10.5% | 13.2% |
Similar Demographics by Wage/Income Gap
Demographics Similar to Americans by Wage/Income Gap
In terms of wage/income gap, the demographic groups most similar to Americans are Bulgarian (27.8%, a difference of 0.040%), Immigrants from Japan (27.9%, a difference of 0.080%), Lebanese (27.9%, a difference of 0.11%), Latvian (27.9%, a difference of 0.11%), and Immigrants from Korea (27.8%, a difference of 0.15%).
| Demographics | Rating | Rank | Wage/Income Gap |
| Turks | 1.0 /100 | #267 | Tragic 27.7% |
| New Zealanders | 1.0 /100 | #268 | Tragic 27.7% |
| Potawatomi | 0.9 /100 | #269 | Tragic 27.7% |
| Immigrants | Western Europe | 0.9 /100 | #270 | Tragic 27.8% |
| Ute | 0.8 /100 | #271 | Tragic 27.8% |
| Immigrants | Korea | 0.8 /100 | #272 | Tragic 27.8% |
| Bulgarians | 0.7 /100 | #273 | Tragic 27.8% |
| Americans | 0.7 /100 | #274 | Tragic 27.8% |
| Immigrants | Japan | 0.7 /100 | #275 | Tragic 27.9% |
| Lebanese | 0.7 /100 | #276 | Tragic 27.9% |
| Latvians | 0.7 /100 | #277 | Tragic 27.9% |
| Immigrants | England | 0.6 /100 | #278 | Tragic 27.9% |
| Romanians | 0.5 /100 | #279 | Tragic 28.0% |
| Russians | 0.5 /100 | #280 | Tragic 28.0% |
| Burmese | 0.5 /100 | #281 | Tragic 28.0% |
Demographics Similar to Immigrants from Italy by Wage/Income Gap
In terms of wage/income gap, the demographic groups most similar to Immigrants from Italy are Indian (Asian) (26.4%, a difference of 0.080%), Immigrants from Southern Europe (26.4%, a difference of 0.17%), Immigrants from Russia (26.4%, a difference of 0.35%), Laotian (26.4%, a difference of 0.37%), and Immigrants from Eastern Europe (26.4%, a difference of 0.37%).
| Demographics | Rating | Rank | Wage/Income Gap |
| Delaware | 20.9 /100 | #200 | Fair 26.3% |
| Immigrants | Syria | 19.3 /100 | #201 | Poor 26.4% |
| Laotians | 19.2 /100 | #202 | Poor 26.4% |
| Immigrants | Eastern Europe | 19.2 /100 | #203 | Poor 26.4% |
| Immigrants | Russia | 19.0 /100 | #204 | Poor 26.4% |
| Immigrants | Southern Europe | 17.3 /100 | #205 | Poor 26.4% |
| Indians (Asian) | 16.5 /100 | #206 | Poor 26.4% |
| Immigrants | Italy | 15.8 /100 | #207 | Poor 26.5% |
| Egyptians | 12.7 /100 | #208 | Poor 26.6% |
| Immigrants | Kuwait | 12.6 /100 | #209 | Poor 26.6% |
| Arabs | 12.3 /100 | #210 | Poor 26.6% |
| Mongolians | 11.4 /100 | #211 | Poor 26.6% |
| Iraqis | 11.2 /100 | #212 | Poor 26.6% |
| Immigrants | Iraq | 10.3 /100 | #213 | Poor 26.7% |
| Immigrants | China | 10.3 /100 | #214 | Poor 26.7% |