Immigrants from Senegal vs German Wage/Income Gap
COMPARE
Immigrants from Senegal
German
Wage/Income Gap
Wage/Income Gap Comparison
Immigrants from Senegal
Germans
20.9%
WAGE/INCOME GAP
100.0/ 100
METRIC RATING
29th/ 347
METRIC RANK
29.2%
WAGE/INCOME GAP
0.0/ 100
METRIC RATING
330th/ 347
METRIC RANK
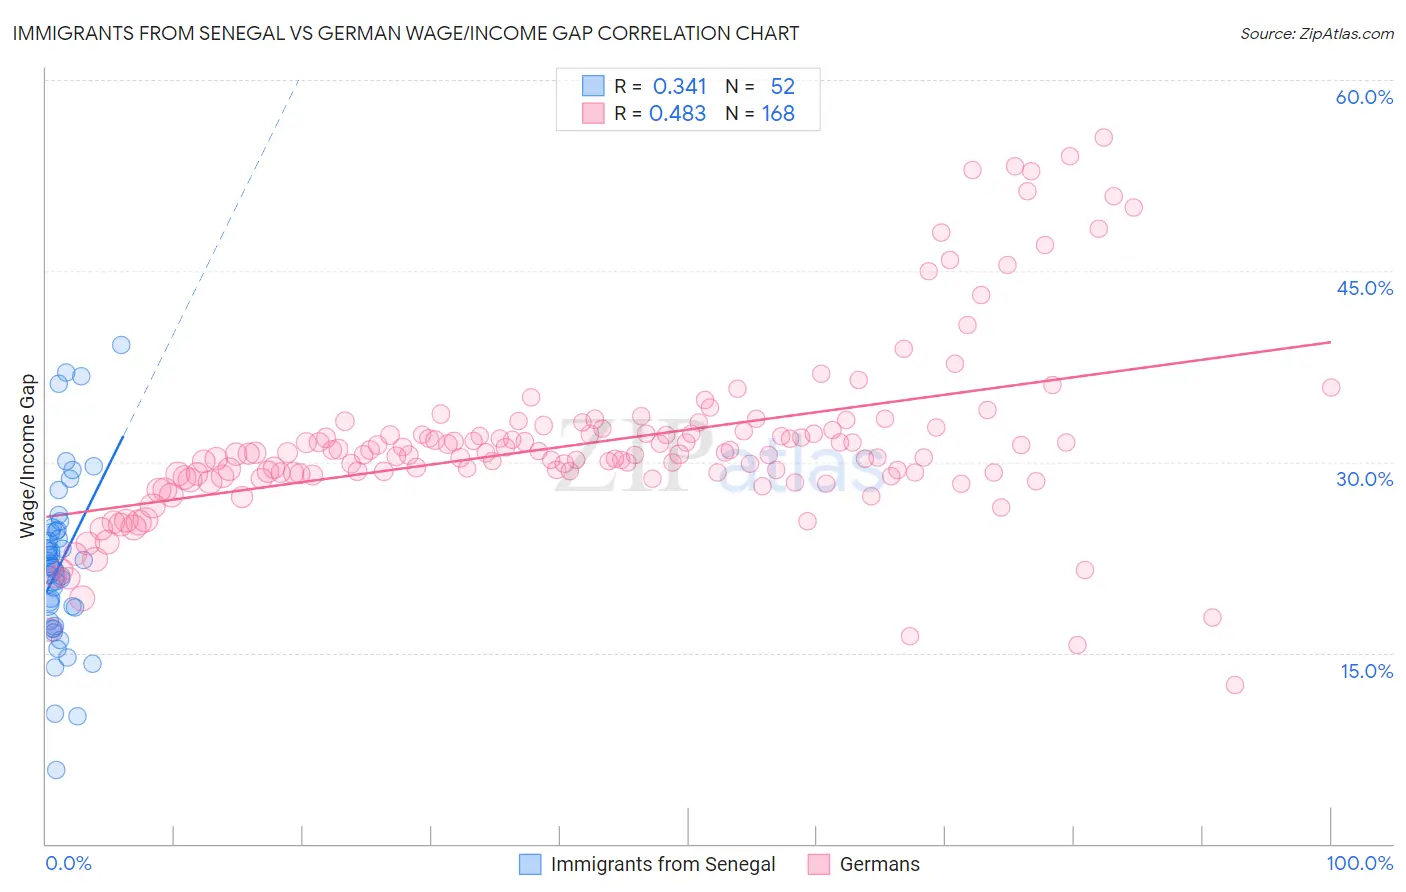
Immigrants from Senegal vs German Wage/Income Gap Correlation Chart
The statistical analysis conducted on geographies consisting of 90,124,089 people shows a mild positive correlation between the proportion of Immigrants from Senegal and wage/income gap percentage in the United States with a correlation coefficient (R) of 0.341 and weighted average of 20.9%. Similarly, the statistical analysis conducted on geographies consisting of 576,849,006 people shows a moderate positive correlation between the proportion of Germans and wage/income gap percentage in the United States with a correlation coefficient (R) of 0.483 and weighted average of 29.2%, a difference of 39.5%.
Wage/Income Gap Correlation Summary
| Measurement | Immigrants from Senegal | German |
| Minimum | 5.7% | 12.4% |
| Maximum | 39.2% | 55.5% |
| Range | 33.4% | 43.0% |
| Mean | 22.0% | 31.5% |
| Median | 21.9% | 30.6% |
| Interquartile 25% (IQ1) | 18.0% | 29.0% |
| Interquartile 75% (IQ3) | 24.6% | 32.3% |
| Interquartile Range (IQR) | 6.6% | 3.3% |
| Standard Deviation (Sample) | 6.6% | 7.0% |
| Standard Deviation (Population) | 6.6% | 7.0% |
Similar Demographics by Wage/Income Gap
Demographics Similar to Immigrants from Senegal by Wage/Income Gap
In terms of wage/income gap, the demographic groups most similar to Immigrants from Senegal are Immigrants from Bangladesh (20.9%, a difference of 0.21%), Vietnamese (21.0%, a difference of 0.49%), Inupiat (20.8%, a difference of 0.62%), Immigrants from Yemen (21.1%, a difference of 0.73%), and Immigrants from Bahamas (21.1%, a difference of 0.74%).
| Demographics | Rating | Rank | Wage/Income Gap |
| Immigrants | Liberia | 100.0 /100 | #22 | Exceptional 20.6% |
| Immigrants | Dominican Republic | 100.0 /100 | #23 | Exceptional 20.6% |
| Dominicans | 100.0 /100 | #24 | Exceptional 20.6% |
| Senegalese | 100.0 /100 | #25 | Exceptional 20.7% |
| Pueblo | 100.0 /100 | #26 | Exceptional 20.7% |
| Immigrants | Armenia | 100.0 /100 | #27 | Exceptional 20.7% |
| Inupiat | 100.0 /100 | #28 | Exceptional 20.8% |
| Immigrants | Senegal | 100.0 /100 | #29 | Exceptional 20.9% |
| Immigrants | Bangladesh | 100.0 /100 | #30 | Exceptional 20.9% |
| Vietnamese | 100.0 /100 | #31 | Exceptional 21.0% |
| Immigrants | Yemen | 100.0 /100 | #32 | Exceptional 21.1% |
| Immigrants | Bahamas | 100.0 /100 | #33 | Exceptional 21.1% |
| Pima | 100.0 /100 | #34 | Exceptional 21.1% |
| Somalis | 100.0 /100 | #35 | Exceptional 21.2% |
| Belizeans | 100.0 /100 | #36 | Exceptional 21.2% |
Demographics Similar to Germans by Wage/Income Gap
In terms of wage/income gap, the demographic groups most similar to Germans are Czech (29.2%, a difference of 0.050%), Scottish (29.1%, a difference of 0.10%), Scandinavian (29.1%, a difference of 0.24%), Immigrants from Iran (29.1%, a difference of 0.30%), and Immigrants from Belgium (29.0%, a difference of 0.41%).
| Demographics | Rating | Rank | Wage/Income Gap |
| Norwegians | 0.1 /100 | #323 | Tragic 29.0% |
| Croatians | 0.0 /100 | #324 | Tragic 29.0% |
| Hungarians | 0.0 /100 | #325 | Tragic 29.0% |
| Immigrants | Belgium | 0.0 /100 | #326 | Tragic 29.0% |
| Immigrants | Iran | 0.0 /100 | #327 | Tragic 29.1% |
| Scandinavians | 0.0 /100 | #328 | Tragic 29.1% |
| Scottish | 0.0 /100 | #329 | Tragic 29.1% |
| Germans | 0.0 /100 | #330 | Tragic 29.2% |
| Czechs | 0.0 /100 | #331 | Tragic 29.2% |
| Immigrants | South Central Asia | 0.0 /100 | #332 | Tragic 29.3% |
| Europeans | 0.0 /100 | #333 | Tragic 29.4% |
| Swedes | 0.0 /100 | #334 | Tragic 29.4% |
| Immigrants | Taiwan | 0.0 /100 | #335 | Tragic 29.5% |
| English | 0.0 /100 | #336 | Tragic 29.5% |
| Dutch | 0.0 /100 | #337 | Tragic 29.6% |