Immigrants from Scotland vs Bermudan Wage/Income Gap
COMPARE
Immigrants from Scotland
Bermudan
Wage/Income Gap
Wage/Income Gap Comparison
Immigrants from Scotland
Bermudans
28.7%
WAGE/INCOME GAP
0.1/ 100
METRIC RATING
314th/ 347
METRIC RANK
23.1%
WAGE/INCOME GAP
99.8/ 100
METRIC RATING
81st/ 347
METRIC RANK
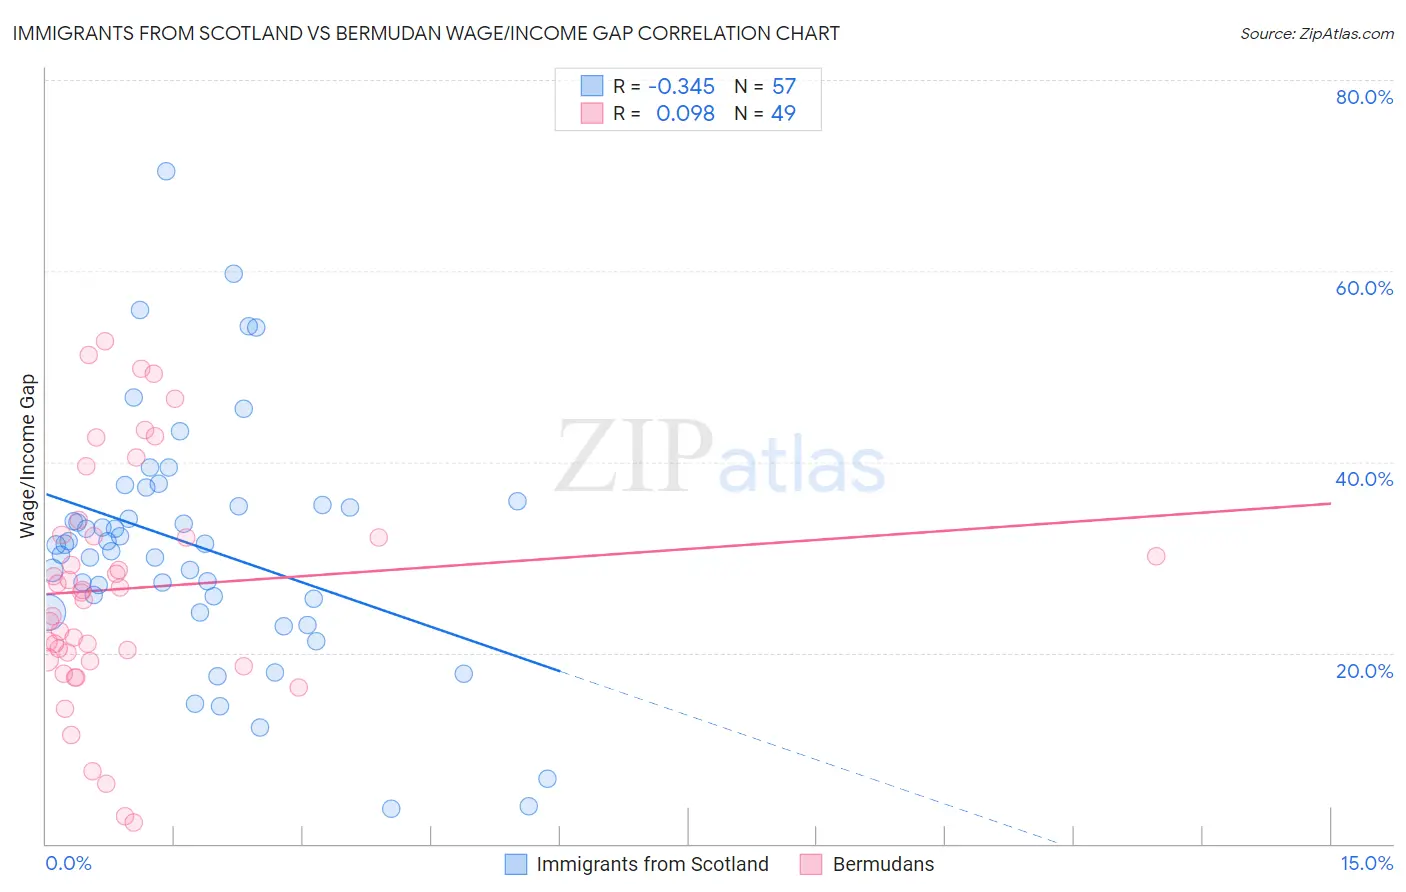
Immigrants from Scotland vs Bermudan Wage/Income Gap Correlation Chart
The statistical analysis conducted on geographies consisting of 196,317,574 people shows a mild negative correlation between the proportion of Immigrants from Scotland and wage/income gap percentage in the United States with a correlation coefficient (R) of -0.345 and weighted average of 28.7%. Similarly, the statistical analysis conducted on geographies consisting of 55,726,543 people shows a slight positive correlation between the proportion of Bermudans and wage/income gap percentage in the United States with a correlation coefficient (R) of 0.098 and weighted average of 23.1%, a difference of 24.3%.
Wage/Income Gap Correlation Summary
| Measurement | Immigrants from Scotland | Bermudan |
| Minimum | 3.7% | 2.2% |
| Maximum | 70.5% | 52.7% |
| Range | 66.8% | 50.5% |
| Mean | 31.2% | 26.7% |
| Median | 31.4% | 26.3% |
| Interquartile 25% (IQ1) | 24.9% | 19.2% |
| Interquartile 75% (IQ3) | 35.7% | 32.3% |
| Interquartile Range (IQR) | 10.7% | 13.1% |
| Standard Deviation (Sample) | 12.7% | 12.3% |
| Standard Deviation (Population) | 12.6% | 12.1% |
Similar Demographics by Wage/Income Gap
Demographics Similar to Immigrants from Scotland by Wage/Income Gap
In terms of wage/income gap, the demographic groups most similar to Immigrants from Scotland are Maltese (28.7%, a difference of 0.050%), Lithuanian (28.7%, a difference of 0.060%), French (28.7%, a difference of 0.15%), Belgian (28.8%, a difference of 0.17%), and Basque (28.8%, a difference of 0.22%).
| Demographics | Rating | Rank | Wage/Income Gap |
| Immigrants | Denmark | 0.1 /100 | #307 | Tragic 28.5% |
| Poles | 0.1 /100 | #308 | Tragic 28.5% |
| Macedonians | 0.1 /100 | #309 | Tragic 28.6% |
| Finns | 0.1 /100 | #310 | Tragic 28.6% |
| Immigrants | Lithuania | 0.1 /100 | #311 | Tragic 28.6% |
| Eastern Europeans | 0.1 /100 | #312 | Tragic 28.6% |
| French | 0.1 /100 | #313 | Tragic 28.7% |
| Immigrants | Scotland | 0.1 /100 | #314 | Tragic 28.7% |
| Maltese | 0.1 /100 | #315 | Tragic 28.7% |
| Lithuanians | 0.1 /100 | #316 | Tragic 28.7% |
| Belgians | 0.1 /100 | #317 | Tragic 28.8% |
| Basques | 0.1 /100 | #318 | Tragic 28.8% |
| Slovaks | 0.1 /100 | #319 | Tragic 28.9% |
| British | 0.1 /100 | #320 | Tragic 28.9% |
| Welsh | 0.1 /100 | #321 | Tragic 28.9% |
Demographics Similar to Bermudans by Wage/Income Gap
In terms of wage/income gap, the demographic groups most similar to Bermudans are Central American (23.1%, a difference of 0.0%), Immigrants from Africa (23.2%, a difference of 0.29%), Salvadoran (23.0%, a difference of 0.47%), Immigrants from Nicaragua (23.0%, a difference of 0.54%), and Nigerian (23.0%, a difference of 0.62%).
| Demographics | Rating | Rank | Wage/Income Gap |
| Immigrants | Burma/Myanmar | 99.9 /100 | #74 | Exceptional 22.8% |
| Fijians | 99.9 /100 | #75 | Exceptional 22.9% |
| Ecuadorians | 99.9 /100 | #76 | Exceptional 22.9% |
| Africans | 99.9 /100 | #77 | Exceptional 22.9% |
| Nigerians | 99.9 /100 | #78 | Exceptional 23.0% |
| Immigrants | Nicaragua | 99.9 /100 | #79 | Exceptional 23.0% |
| Salvadorans | 99.9 /100 | #80 | Exceptional 23.0% |
| Bermudans | 99.8 /100 | #81 | Exceptional 23.1% |
| Central Americans | 99.8 /100 | #82 | Exceptional 23.1% |
| Immigrants | Africa | 99.8 /100 | #83 | Exceptional 23.2% |
| Cubans | 99.7 /100 | #84 | Exceptional 23.3% |
| Immigrants | Cambodia | 99.7 /100 | #85 | Exceptional 23.3% |
| Cheyenne | 99.7 /100 | #86 | Exceptional 23.3% |
| Yuman | 99.7 /100 | #87 | Exceptional 23.3% |
| Immigrants | Panama | 99.6 /100 | #88 | Exceptional 23.4% |