Immigrants from Egypt vs Bermudan Wage/Income Gap
COMPARE
Immigrants from Egypt
Bermudan
Wage/Income Gap
Wage/Income Gap Comparison
Immigrants from Egypt
Bermudans
26.1%
WAGE/INCOME GAP
29.9/ 100
METRIC RATING
188th/ 347
METRIC RANK
23.1%
WAGE/INCOME GAP
99.8/ 100
METRIC RATING
81st/ 347
METRIC RANK
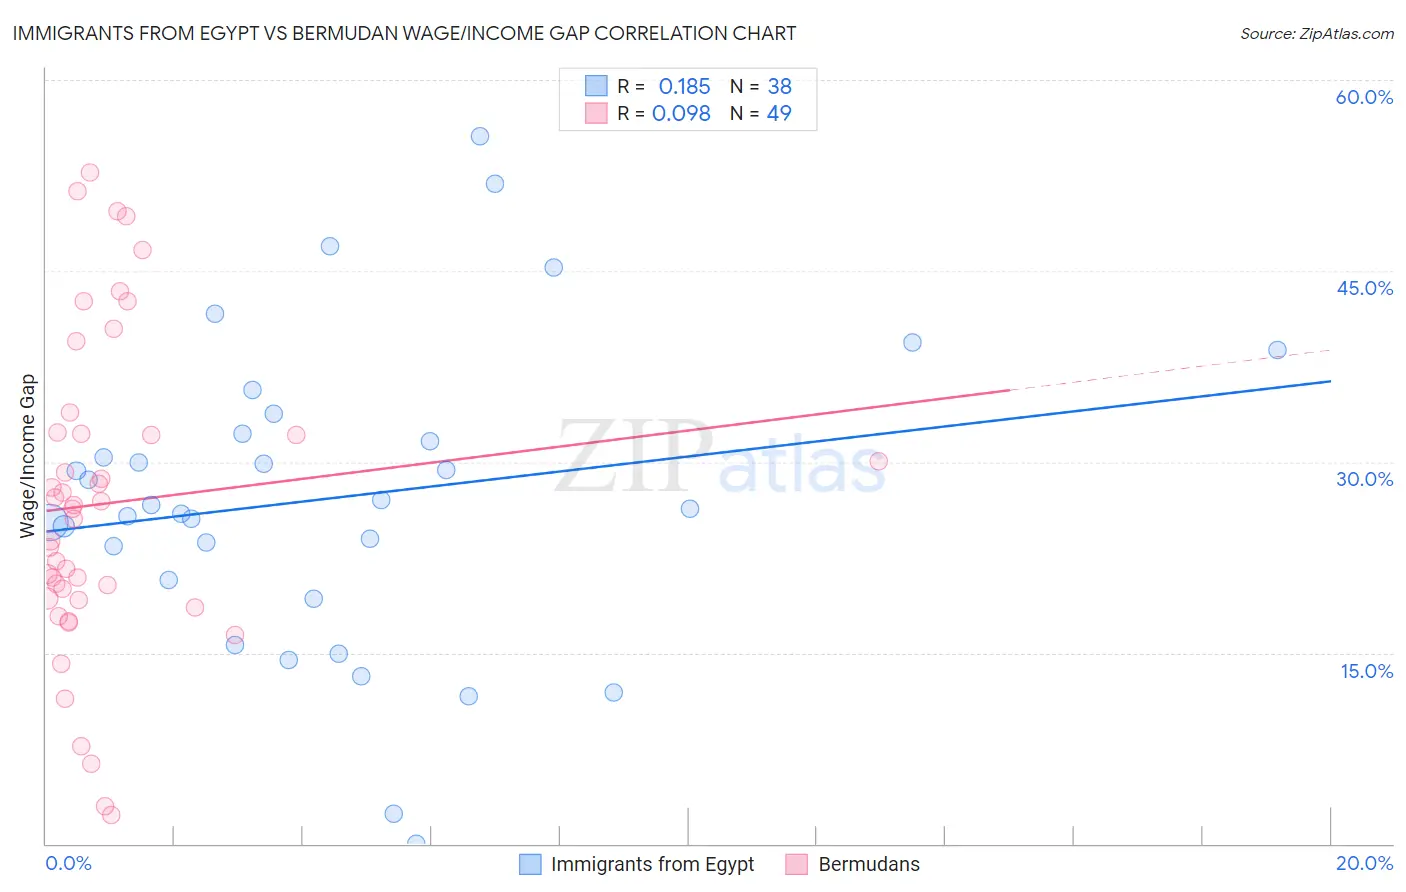
Immigrants from Egypt vs Bermudan Wage/Income Gap Correlation Chart
The statistical analysis conducted on geographies consisting of 245,435,897 people shows a poor positive correlation between the proportion of Immigrants from Egypt and wage/income gap percentage in the United States with a correlation coefficient (R) of 0.185 and weighted average of 26.1%. Similarly, the statistical analysis conducted on geographies consisting of 55,726,543 people shows a slight positive correlation between the proportion of Bermudans and wage/income gap percentage in the United States with a correlation coefficient (R) of 0.098 and weighted average of 23.1%, a difference of 13.1%.
Wage/Income Gap Correlation Summary
| Measurement | Immigrants from Egypt | Bermudan |
| Minimum | 0.012% | 2.2% |
| Maximum | 55.6% | 52.7% |
| Range | 55.5% | 50.5% |
| Mean | 27.2% | 26.7% |
| Median | 26.5% | 26.3% |
| Interquartile 25% (IQ1) | 20.8% | 19.2% |
| Interquartile 75% (IQ3) | 32.2% | 32.3% |
| Interquartile Range (IQR) | 11.4% | 13.1% |
| Standard Deviation (Sample) | 12.1% | 12.3% |
| Standard Deviation (Population) | 12.0% | 12.1% |
Similar Demographics by Wage/Income Gap
Demographics Similar to Immigrants from Egypt by Wage/Income Gap
In terms of wage/income gap, the demographic groups most similar to Immigrants from Egypt are Palestinian (26.1%, a difference of 0.010%), Immigrants from Indonesia (26.1%, a difference of 0.20%), Immigrants from Moldova (26.2%, a difference of 0.26%), Pakistani (26.1%, a difference of 0.29%), and Mexican (26.0%, a difference of 0.34%).
| Demographics | Rating | Rank | Wage/Income Gap |
| Immigrants | Bolivia | 36.4 /100 | #181 | Fair 26.0% |
| Immigrants | Serbia | 35.4 /100 | #182 | Fair 26.0% |
| Immigrants | Kazakhstan | 35.2 /100 | #183 | Fair 26.0% |
| Mexicans | 34.4 /100 | #184 | Fair 26.0% |
| Pakistanis | 33.7 /100 | #185 | Fair 26.1% |
| Immigrants | Indonesia | 32.5 /100 | #186 | Fair 26.1% |
| Palestinians | 29.9 /100 | #187 | Fair 26.1% |
| Immigrants | Egypt | 29.9 /100 | #188 | Fair 26.1% |
| Immigrants | Moldova | 26.6 /100 | #189 | Fair 26.2% |
| Immigrants | Croatia | 24.8 /100 | #190 | Fair 26.2% |
| Immigrants | Venezuela | 24.7 /100 | #191 | Fair 26.2% |
| Immigrants | Bulgaria | 22.5 /100 | #192 | Fair 26.3% |
| Immigrants | Jordan | 22.4 /100 | #193 | Fair 26.3% |
| Chileans | 22.3 /100 | #194 | Fair 26.3% |
| Immigrants | Malaysia | 22.2 /100 | #195 | Fair 26.3% |
Demographics Similar to Bermudans by Wage/Income Gap
In terms of wage/income gap, the demographic groups most similar to Bermudans are Central American (23.1%, a difference of 0.0%), Immigrants from Africa (23.2%, a difference of 0.29%), Salvadoran (23.0%, a difference of 0.47%), Immigrants from Nicaragua (23.0%, a difference of 0.54%), and Nigerian (23.0%, a difference of 0.62%).
| Demographics | Rating | Rank | Wage/Income Gap |
| Immigrants | Burma/Myanmar | 99.9 /100 | #74 | Exceptional 22.8% |
| Fijians | 99.9 /100 | #75 | Exceptional 22.9% |
| Ecuadorians | 99.9 /100 | #76 | Exceptional 22.9% |
| Africans | 99.9 /100 | #77 | Exceptional 22.9% |
| Nigerians | 99.9 /100 | #78 | Exceptional 23.0% |
| Immigrants | Nicaragua | 99.9 /100 | #79 | Exceptional 23.0% |
| Salvadorans | 99.9 /100 | #80 | Exceptional 23.0% |
| Bermudans | 99.8 /100 | #81 | Exceptional 23.1% |
| Central Americans | 99.8 /100 | #82 | Exceptional 23.1% |
| Immigrants | Africa | 99.8 /100 | #83 | Exceptional 23.2% |
| Cubans | 99.7 /100 | #84 | Exceptional 23.3% |
| Immigrants | Cambodia | 99.7 /100 | #85 | Exceptional 23.3% |
| Cheyenne | 99.7 /100 | #86 | Exceptional 23.3% |
| Yuman | 99.7 /100 | #87 | Exceptional 23.3% |
| Immigrants | Panama | 99.6 /100 | #88 | Exceptional 23.4% |