Immigrants from Nepal vs Bermudan Wage/Income Gap
COMPARE
Immigrants from Nepal
Bermudan
Wage/Income Gap
Wage/Income Gap Comparison
Immigrants from Nepal
Bermudans
24.9%
WAGE/INCOME GAP
89.3/ 100
METRIC RATING
140th/ 347
METRIC RANK
23.1%
WAGE/INCOME GAP
99.8/ 100
METRIC RATING
81st/ 347
METRIC RANK
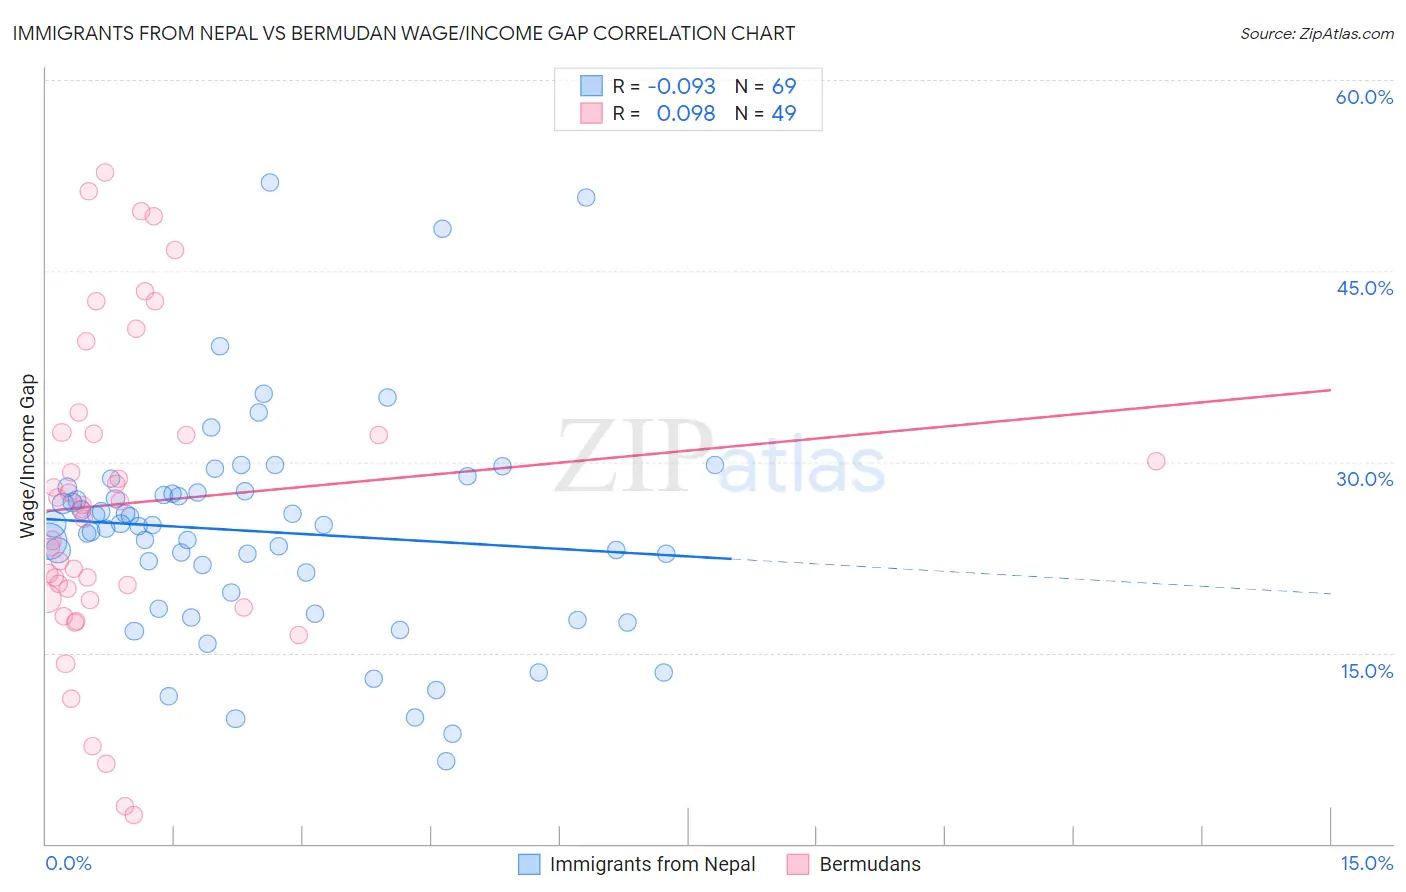
Immigrants from Nepal vs Bermudan Wage/Income Gap Correlation Chart
The statistical analysis conducted on geographies consisting of 186,773,230 people shows a slight negative correlation between the proportion of Immigrants from Nepal and wage/income gap percentage in the United States with a correlation coefficient (R) of -0.093 and weighted average of 24.9%. Similarly, the statistical analysis conducted on geographies consisting of 55,726,543 people shows a slight positive correlation between the proportion of Bermudans and wage/income gap percentage in the United States with a correlation coefficient (R) of 0.098 and weighted average of 23.1%, a difference of 7.6%.
Wage/Income Gap Correlation Summary
| Measurement | Immigrants from Nepal | Bermudan |
| Minimum | 6.5% | 2.2% |
| Maximum | 52.0% | 52.7% |
| Range | 45.5% | 50.5% |
| Mean | 24.5% | 26.7% |
| Median | 25.0% | 26.3% |
| Interquartile 25% (IQ1) | 19.1% | 19.2% |
| Interquartile 75% (IQ3) | 27.6% | 32.3% |
| Interquartile Range (IQR) | 8.5% | 13.1% |
| Standard Deviation (Sample) | 8.6% | 12.3% |
| Standard Deviation (Population) | 8.6% | 12.1% |
Similar Demographics by Wage/Income Gap
Demographics Similar to Immigrants from Nepal by Wage/Income Gap
In terms of wage/income gap, the demographic groups most similar to Immigrants from Nepal are Hawaiian (24.9%, a difference of 0.010%), Hispanic or Latino (24.9%, a difference of 0.030%), Immigrants from Bosnia and Herzegovina (24.8%, a difference of 0.14%), Afghan (24.9%, a difference of 0.21%), and Immigrants from Uganda (24.9%, a difference of 0.22%).
| Demographics | Rating | Rank | Wage/Income Gap |
| Colombians | 92.4 /100 | #133 | Exceptional 24.7% |
| Mexican American Indians | 92.2 /100 | #134 | Exceptional 24.7% |
| South American Indians | 92.0 /100 | #135 | Exceptional 24.7% |
| Armenians | 91.3 /100 | #136 | Exceptional 24.8% |
| Immigrants | South Eastern Asia | 90.9 /100 | #137 | Exceptional 24.8% |
| Immigrants | Bosnia and Herzegovina | 90.1 /100 | #138 | Exceptional 24.8% |
| Hispanics or Latinos | 89.5 /100 | #139 | Excellent 24.9% |
| Immigrants | Nepal | 89.3 /100 | #140 | Excellent 24.9% |
| Hawaiians | 89.3 /100 | #141 | Excellent 24.9% |
| Afghans | 88.1 /100 | #142 | Excellent 24.9% |
| Immigrants | Uganda | 88.0 /100 | #143 | Excellent 24.9% |
| Chippewa | 86.9 /100 | #144 | Excellent 25.0% |
| Comanche | 85.2 /100 | #145 | Excellent 25.0% |
| South Americans | 85.2 /100 | #146 | Excellent 25.0% |
| Malaysians | 84.9 /100 | #147 | Excellent 25.0% |
Demographics Similar to Bermudans by Wage/Income Gap
In terms of wage/income gap, the demographic groups most similar to Bermudans are Central American (23.1%, a difference of 0.0%), Immigrants from Africa (23.2%, a difference of 0.29%), Salvadoran (23.0%, a difference of 0.47%), Immigrants from Nicaragua (23.0%, a difference of 0.54%), and Nigerian (23.0%, a difference of 0.62%).
| Demographics | Rating | Rank | Wage/Income Gap |
| Immigrants | Burma/Myanmar | 99.9 /100 | #74 | Exceptional 22.8% |
| Fijians | 99.9 /100 | #75 | Exceptional 22.9% |
| Ecuadorians | 99.9 /100 | #76 | Exceptional 22.9% |
| Africans | 99.9 /100 | #77 | Exceptional 22.9% |
| Nigerians | 99.9 /100 | #78 | Exceptional 23.0% |
| Immigrants | Nicaragua | 99.9 /100 | #79 | Exceptional 23.0% |
| Salvadorans | 99.9 /100 | #80 | Exceptional 23.0% |
| Bermudans | 99.8 /100 | #81 | Exceptional 23.1% |
| Central Americans | 99.8 /100 | #82 | Exceptional 23.1% |
| Immigrants | Africa | 99.8 /100 | #83 | Exceptional 23.2% |
| Cubans | 99.7 /100 | #84 | Exceptional 23.3% |
| Immigrants | Cambodia | 99.7 /100 | #85 | Exceptional 23.3% |
| Cheyenne | 99.7 /100 | #86 | Exceptional 23.3% |
| Yuman | 99.7 /100 | #87 | Exceptional 23.3% |
| Immigrants | Panama | 99.6 /100 | #88 | Exceptional 23.4% |