Chinese vs Bermudan Wage/Income Gap
COMPARE
Chinese
Bermudan
Wage/Income Gap
Wage/Income Gap Comparison
Chinese
Bermudans
25.9%
WAGE/INCOME GAP
42.0/ 100
METRIC RATING
178th/ 347
METRIC RANK
23.1%
WAGE/INCOME GAP
99.8/ 100
METRIC RATING
81st/ 347
METRIC RANK
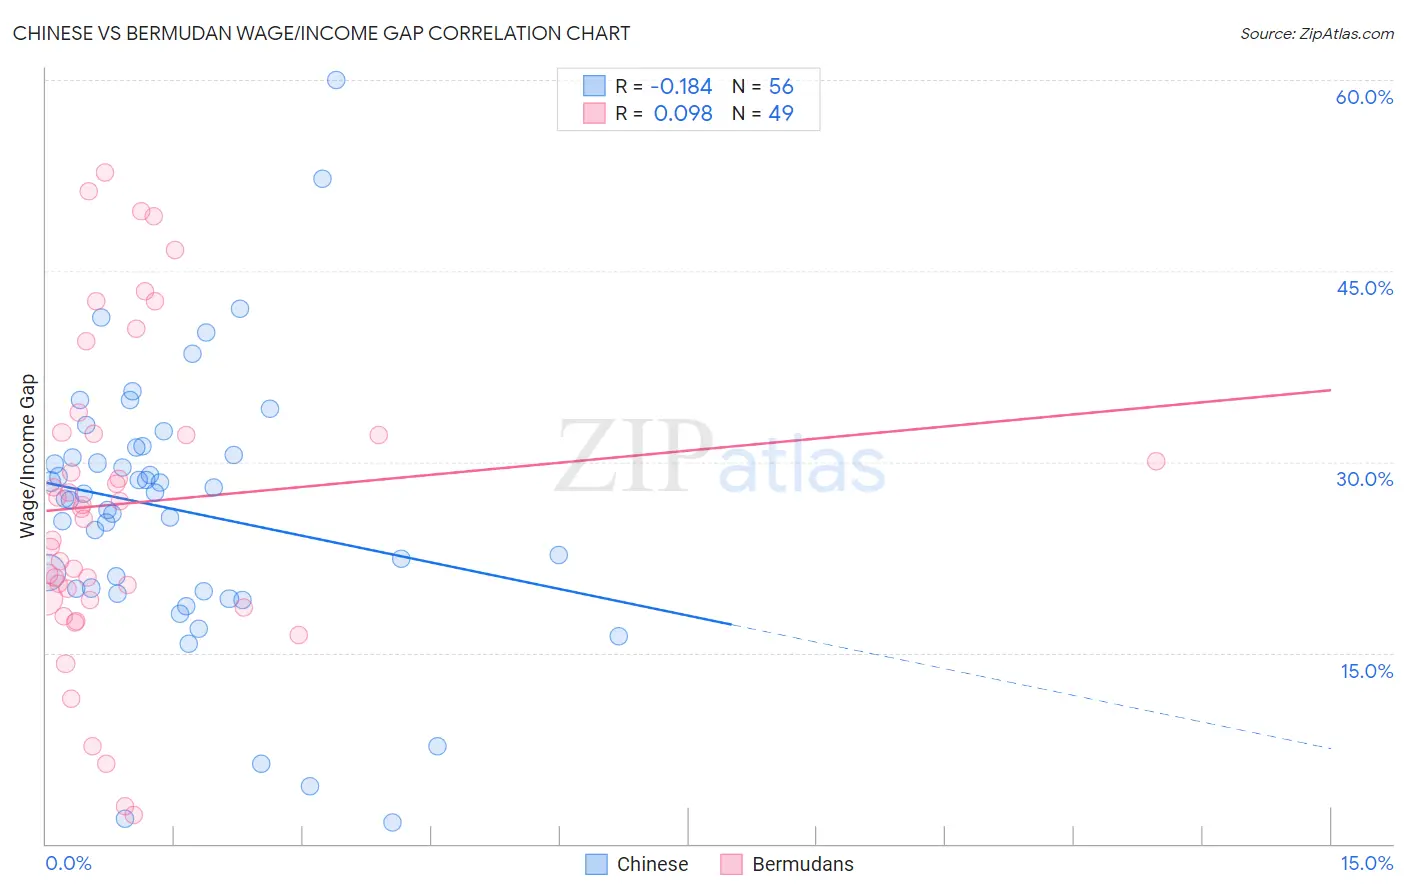
Chinese vs Bermudan Wage/Income Gap Correlation Chart
The statistical analysis conducted on geographies consisting of 64,807,074 people shows a poor negative correlation between the proportion of Chinese and wage/income gap percentage in the United States with a correlation coefficient (R) of -0.184 and weighted average of 25.9%. Similarly, the statistical analysis conducted on geographies consisting of 55,726,543 people shows a slight positive correlation between the proportion of Bermudans and wage/income gap percentage in the United States with a correlation coefficient (R) of 0.098 and weighted average of 23.1%, a difference of 12.1%.
Wage/Income Gap Correlation Summary
| Measurement | Chinese | Bermudan |
| Minimum | 1.7% | 2.2% |
| Maximum | 60.0% | 52.7% |
| Range | 58.3% | 50.5% |
| Mean | 26.2% | 26.7% |
| Median | 27.3% | 26.3% |
| Interquartile 25% (IQ1) | 19.9% | 19.2% |
| Interquartile 75% (IQ3) | 30.9% | 32.3% |
| Interquartile Range (IQR) | 10.9% | 13.1% |
| Standard Deviation (Sample) | 10.8% | 12.3% |
| Standard Deviation (Population) | 10.7% | 12.1% |
Similar Demographics by Wage/Income Gap
Demographics Similar to Chinese by Wage/Income Gap
In terms of wage/income gap, the demographic groups most similar to Chinese are Cambodian (25.8%, a difference of 0.21%), Samoan (26.0%, a difference of 0.23%), Guamanian/Chamorro (26.0%, a difference of 0.27%), Paraguayan (25.8%, a difference of 0.32%), and Sri Lankan (25.8%, a difference of 0.33%).
| Demographics | Rating | Rank | Wage/Income Gap |
| Immigrants | Greece | 56.6 /100 | #171 | Average 25.7% |
| Immigrants | Chile | 53.2 /100 | #172 | Average 25.7% |
| Immigrants | Belarus | 52.9 /100 | #173 | Average 25.7% |
| Alaskan Athabascans | 50.0 /100 | #174 | Average 25.8% |
| Sri Lankans | 47.0 /100 | #175 | Average 25.8% |
| Paraguayans | 46.7 /100 | #176 | Average 25.8% |
| Cambodians | 45.1 /100 | #177 | Average 25.8% |
| Chinese | 42.0 /100 | #178 | Average 25.9% |
| Samoans | 38.6 /100 | #179 | Fair 26.0% |
| Guamanians/Chamorros | 38.0 /100 | #180 | Fair 26.0% |
| Immigrants | Bolivia | 36.4 /100 | #181 | Fair 26.0% |
| Immigrants | Serbia | 35.4 /100 | #182 | Fair 26.0% |
| Immigrants | Kazakhstan | 35.2 /100 | #183 | Fair 26.0% |
| Mexicans | 34.4 /100 | #184 | Fair 26.0% |
| Pakistanis | 33.7 /100 | #185 | Fair 26.1% |
Demographics Similar to Bermudans by Wage/Income Gap
In terms of wage/income gap, the demographic groups most similar to Bermudans are Central American (23.1%, a difference of 0.0%), Immigrants from Africa (23.2%, a difference of 0.29%), Salvadoran (23.0%, a difference of 0.47%), Immigrants from Nicaragua (23.0%, a difference of 0.54%), and Nigerian (23.0%, a difference of 0.62%).
| Demographics | Rating | Rank | Wage/Income Gap |
| Immigrants | Burma/Myanmar | 99.9 /100 | #74 | Exceptional 22.8% |
| Fijians | 99.9 /100 | #75 | Exceptional 22.9% |
| Ecuadorians | 99.9 /100 | #76 | Exceptional 22.9% |
| Africans | 99.9 /100 | #77 | Exceptional 22.9% |
| Nigerians | 99.9 /100 | #78 | Exceptional 23.0% |
| Immigrants | Nicaragua | 99.9 /100 | #79 | Exceptional 23.0% |
| Salvadorans | 99.9 /100 | #80 | Exceptional 23.0% |
| Bermudans | 99.8 /100 | #81 | Exceptional 23.1% |
| Central Americans | 99.8 /100 | #82 | Exceptional 23.1% |
| Immigrants | Africa | 99.8 /100 | #83 | Exceptional 23.2% |
| Cubans | 99.7 /100 | #84 | Exceptional 23.3% |
| Immigrants | Cambodia | 99.7 /100 | #85 | Exceptional 23.3% |
| Cheyenne | 99.7 /100 | #86 | Exceptional 23.3% |
| Yuman | 99.7 /100 | #87 | Exceptional 23.3% |
| Immigrants | Panama | 99.6 /100 | #88 | Exceptional 23.4% |