Immigrants from Japan vs Immigrants from Vietnam Median Family Income
COMPARE
Immigrants from Japan
Immigrants from Vietnam
Median Family Income
Median Family Income Comparison
Immigrants from Japan
Immigrants from Vietnam
$122,764
MEDIAN FAMILY INCOME
100.0/ 100
METRIC RATING
23rd/ 347
METRIC RANK
$106,186
MEDIAN FAMILY INCOME
85.7/ 100
METRIC RATING
138th/ 347
METRIC RANK
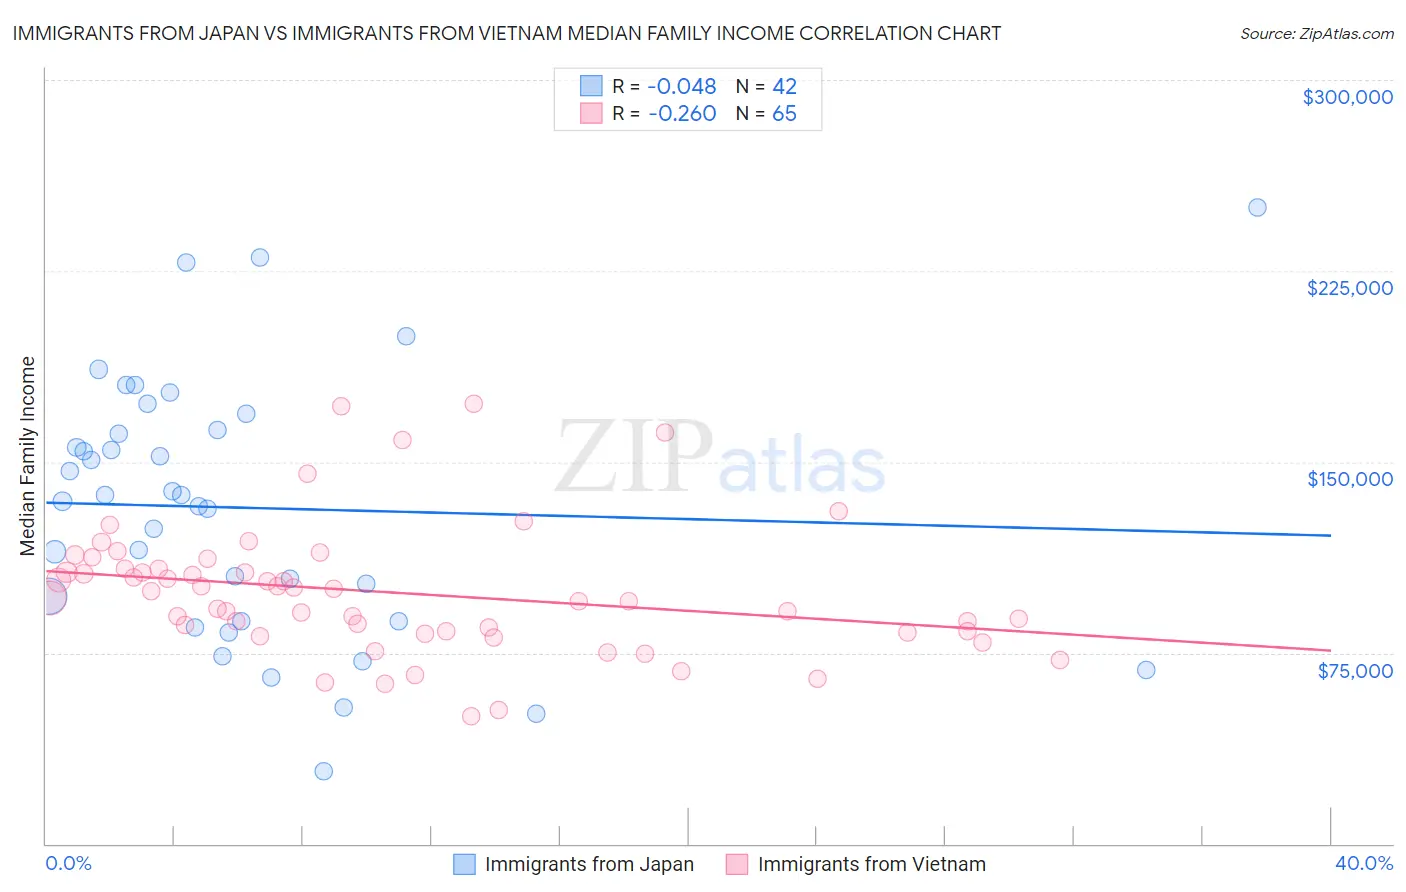
Immigrants from Japan vs Immigrants from Vietnam Median Family Income Correlation Chart
The statistical analysis conducted on geographies consisting of 339,915,551 people shows no correlation between the proportion of Immigrants from Japan and median family income in the United States with a correlation coefficient (R) of -0.048 and weighted average of $122,764. Similarly, the statistical analysis conducted on geographies consisting of 404,425,840 people shows a weak negative correlation between the proportion of Immigrants from Vietnam and median family income in the United States with a correlation coefficient (R) of -0.260 and weighted average of $106,186, a difference of 15.6%.
Median Family Income Correlation Summary
| Measurement | Immigrants from Japan | Immigrants from Vietnam |
| Minimum | $28,538 | $50,204 |
| Maximum | $250,001 | $172,860 |
| Range | $221,463 | $122,656 |
| Mean | $131,921 | $98,743 |
| Median | $135,669 | $96,507 |
| Interquartile 25% (IQ1) | $87,578 | $83,286 |
| Interquartile 75% (IQ3) | $162,396 | $108,037 |
| Interquartile Range (IQR) | $74,818 | $24,751 |
| Standard Deviation (Sample) | $50,889 | $25,431 |
| Standard Deviation (Population) | $50,280 | $25,234 |
Similar Demographics by Median Family Income
Demographics Similar to Immigrants from Japan by Median Family Income
In terms of median family income, the demographic groups most similar to Immigrants from Japan are Immigrants from Sweden ($122,765, a difference of 0.0%), Immigrants from Korea ($122,800, a difference of 0.030%), Burmese ($123,369, a difference of 0.49%), Immigrants from Northern Europe ($121,840, a difference of 0.76%), and Immigrants from Belgium ($123,831, a difference of 0.87%).
| Demographics | Rating | Rank | Median Family Income |
| Immigrants | China | 100.0 /100 | #16 | Exceptional $125,540 |
| Indians (Asian) | 100.0 /100 | #17 | Exceptional $125,312 |
| Immigrants | Eastern Asia | 100.0 /100 | #18 | Exceptional $125,150 |
| Immigrants | Belgium | 100.0 /100 | #19 | Exceptional $123,831 |
| Burmese | 100.0 /100 | #20 | Exceptional $123,369 |
| Immigrants | Korea | 100.0 /100 | #21 | Exceptional $122,800 |
| Immigrants | Sweden | 100.0 /100 | #22 | Exceptional $122,765 |
| Immigrants | Japan | 100.0 /100 | #23 | Exceptional $122,764 |
| Immigrants | Northern Europe | 100.0 /100 | #24 | Exceptional $121,840 |
| Turks | 100.0 /100 | #25 | Exceptional $121,202 |
| Immigrants | Switzerland | 100.0 /100 | #26 | Exceptional $120,726 |
| Russians | 100.0 /100 | #27 | Exceptional $120,487 |
| Immigrants | Denmark | 100.0 /100 | #28 | Exceptional $120,445 |
| Latvians | 100.0 /100 | #29 | Exceptional $120,301 |
| Immigrants | Sri Lanka | 100.0 /100 | #30 | Exceptional $120,263 |
Demographics Similar to Immigrants from Vietnam by Median Family Income
In terms of median family income, the demographic groups most similar to Immigrants from Vietnam are Immigrants from Uganda ($106,188, a difference of 0.0%), Luxembourger ($106,183, a difference of 0.0%), Norwegian ($106,144, a difference of 0.040%), Immigrants from South Eastern Asia ($106,252, a difference of 0.060%), and Immigrants from Syria ($106,118, a difference of 0.060%).
| Demographics | Rating | Rank | Median Family Income |
| Canadians | 88.1 /100 | #131 | Excellent $106,597 |
| Immigrants | Fiji | 87.8 /100 | #132 | Excellent $106,544 |
| Ugandans | 87.8 /100 | #133 | Excellent $106,541 |
| Immigrants | Oceania | 87.3 /100 | #134 | Excellent $106,453 |
| Portuguese | 86.3 /100 | #135 | Excellent $106,286 |
| Immigrants | South Eastern Asia | 86.1 /100 | #136 | Excellent $106,252 |
| Immigrants | Uganda | 85.7 /100 | #137 | Excellent $106,188 |
| Immigrants | Vietnam | 85.7 /100 | #138 | Excellent $106,186 |
| Luxembourgers | 85.7 /100 | #139 | Excellent $106,183 |
| Norwegians | 85.5 /100 | #140 | Excellent $106,144 |
| Immigrants | Syria | 85.3 /100 | #141 | Excellent $106,118 |
| Slovenes | 84.7 /100 | #142 | Excellent $106,020 |
| Tongans | 84.3 /100 | #143 | Excellent $105,967 |
| Immigrants | Morocco | 84.3 /100 | #144 | Excellent $105,964 |
| Danes | 83.8 /100 | #145 | Excellent $105,900 |